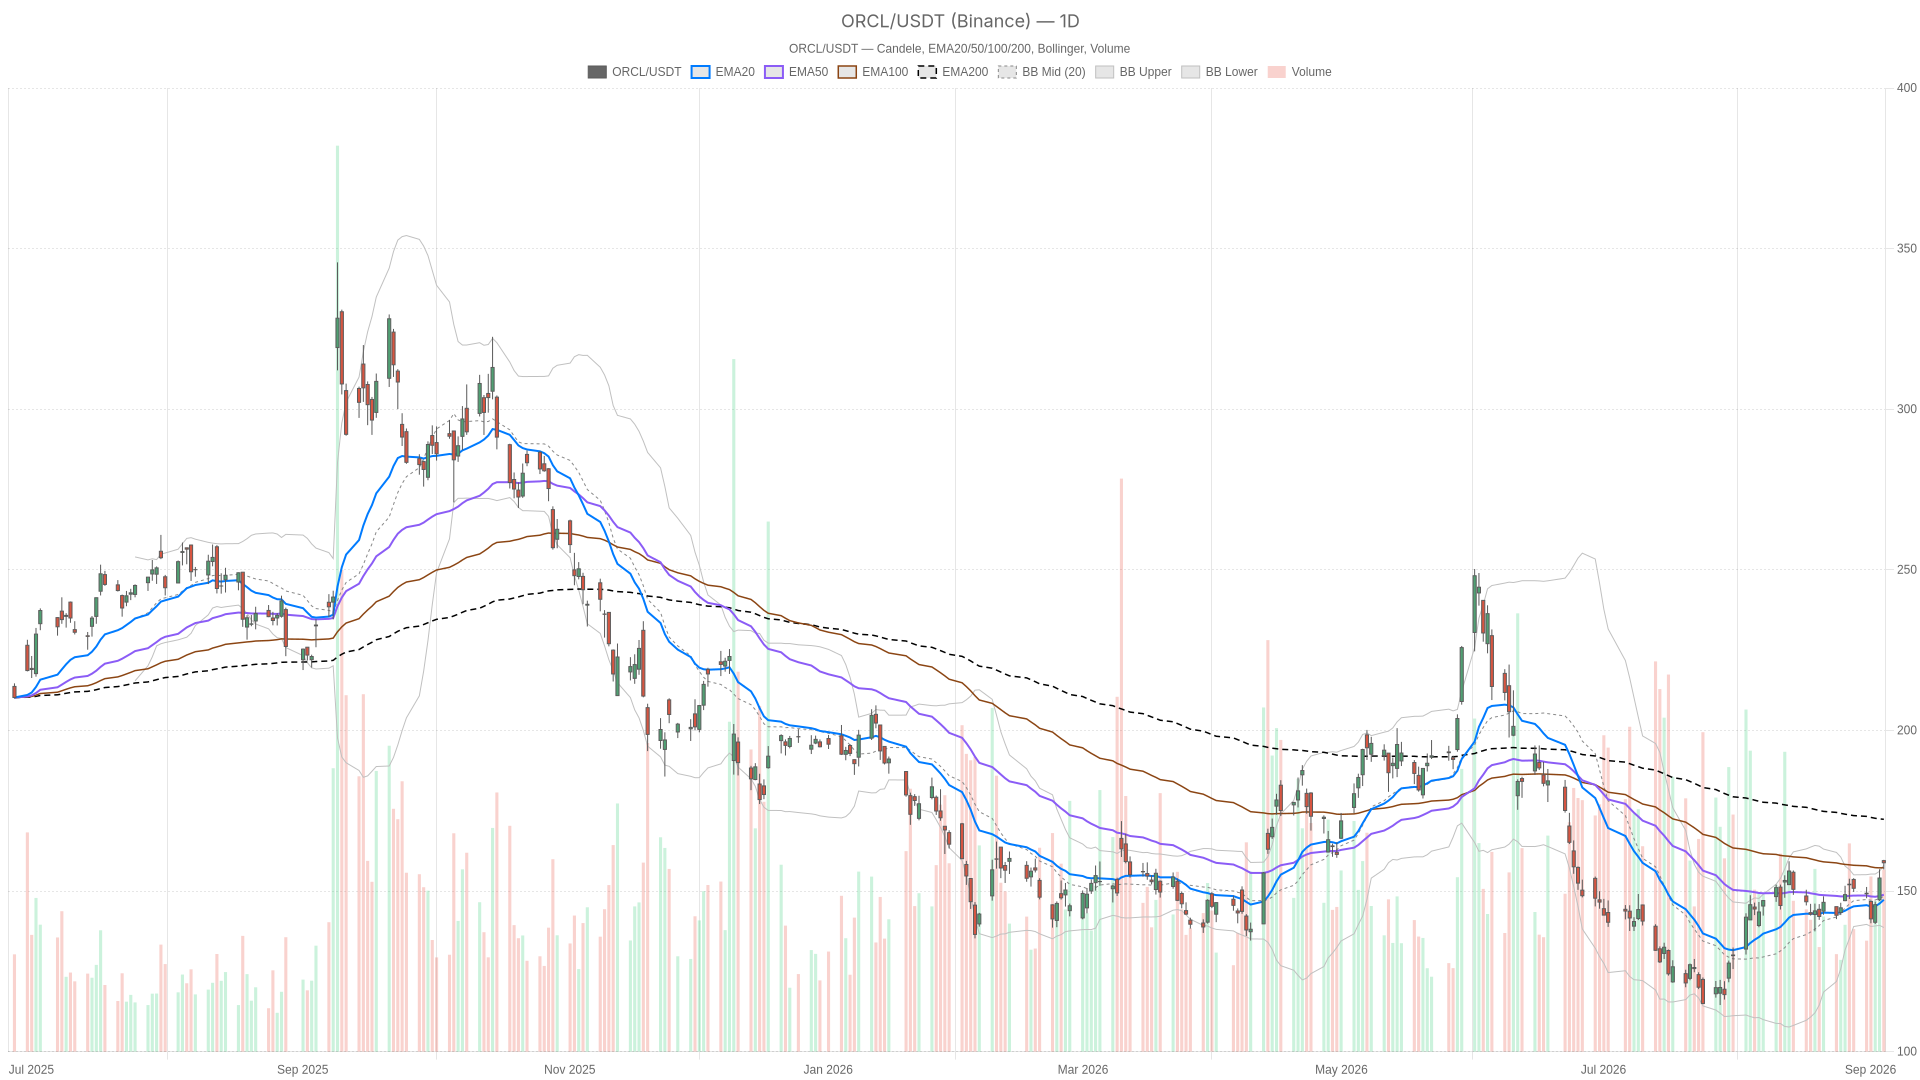
Oracle stock faces a genuine crossroads this week. Price has run hard off its lows yet remains below its long-term trend anchor. The hourly tape is unambiguously bullish. Earnings arrive this week alongside inflation data and fresh scrutiny of Big Tech’s AI debt load.

Key takeaways
- Oracle stock closed at 158.78, above the 20-day and 50-day EMAs but well below the 200-day EMA at 172.32.
- Daily RSI14 at 60.94 reflects solid but not extreme momentum, while the close breaches the upper Bollinger Band at 157.99.
- Hourly trend is fully bullish with EMA stack aligned, but RSI14 at 70.44 has entered overbought territory.
- Daily ATR14 sits elevated at 6.22, signaling high…