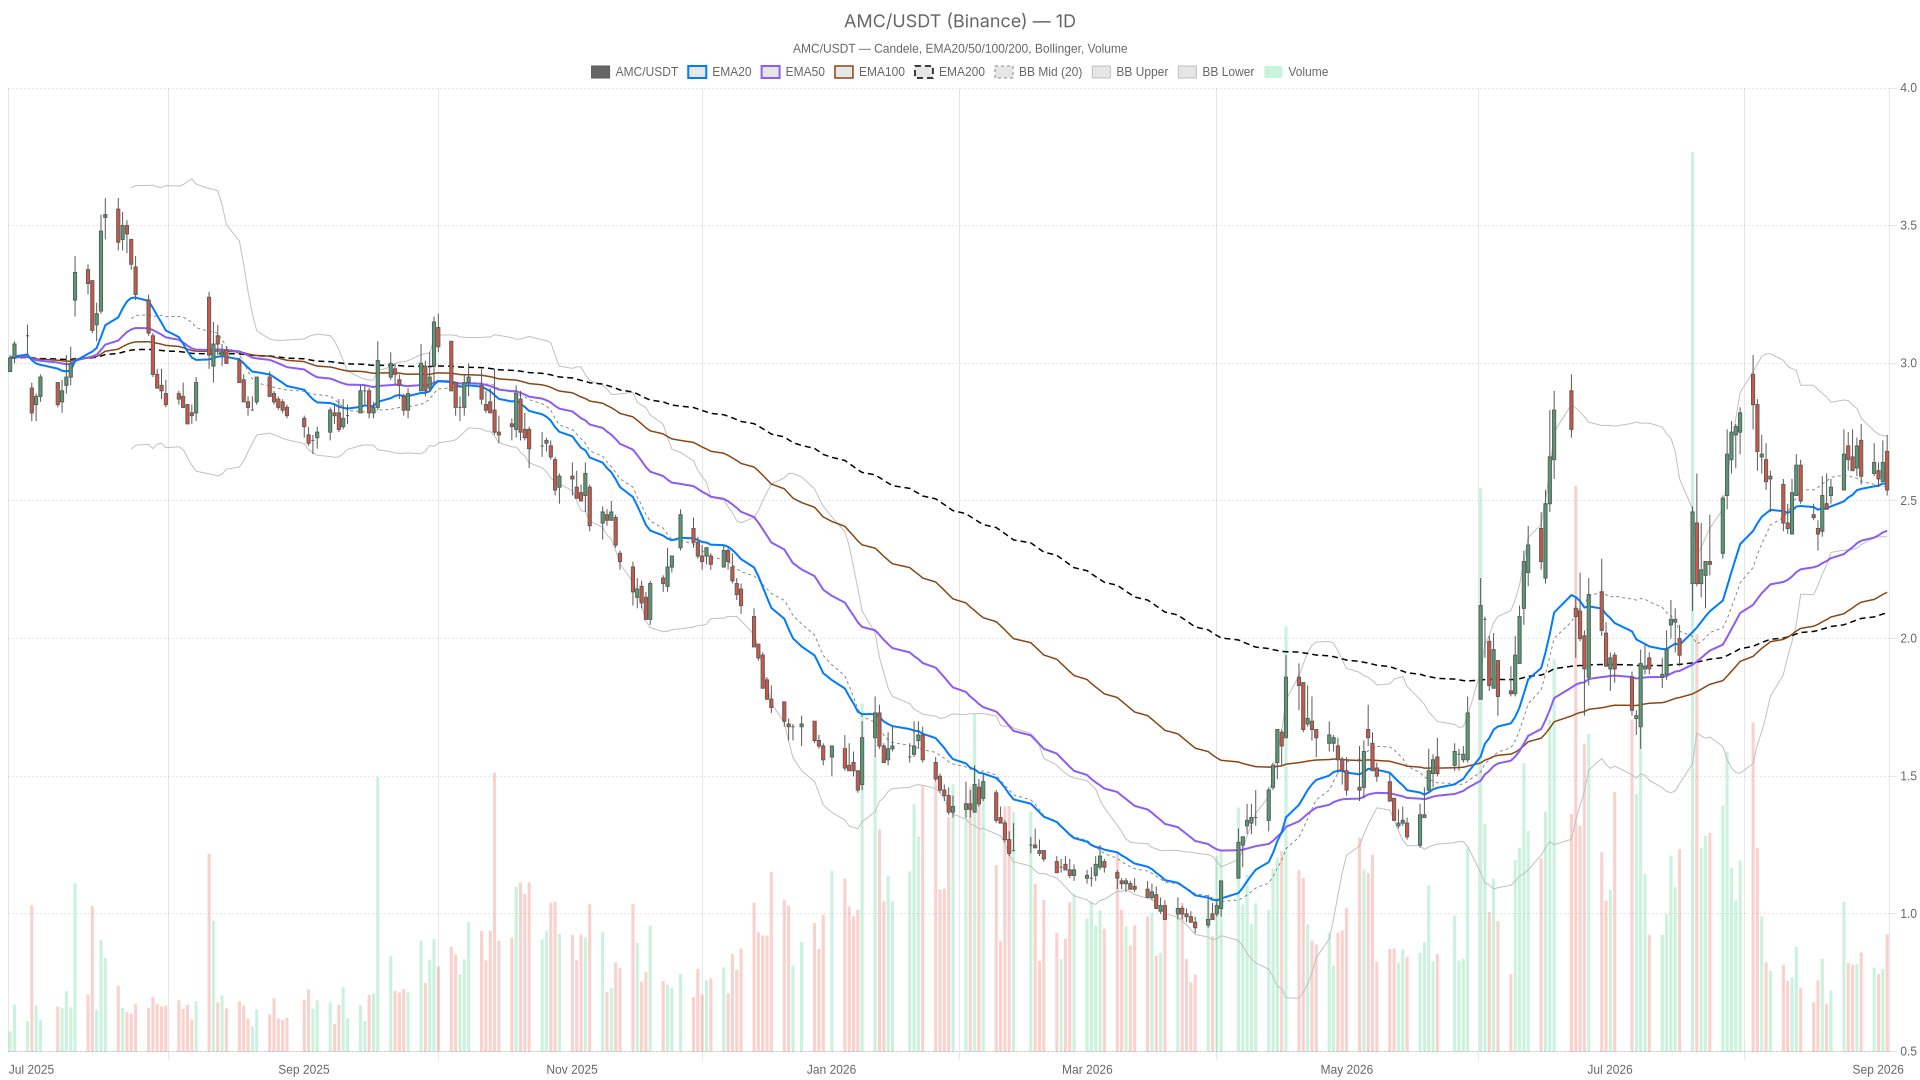
AMC stock sits at a critical crossroads. The daily chart still reflects a constructive long-term structure. Yet the latest session points to fading momentum on the intraday tape. This tension between structure and short-term weakness demands a careful, nuanced read.

Key takeaways
- AMC closed at $2.54 on September 3, down from an open of $2.68, with volume of roughly 24.4 million shares
- The daily EMA stack remains bullish: EMA20 at $2.56, EMA50 at $2.39, and EMA200 at $2.09
- Daily RSI14 at 50.58 signals neutral momentum, while the MACD shows a mild bearish crossover
- Short-term timeframes display bearish pressure, with AMC stock trading below key hourly moving averages
- The…