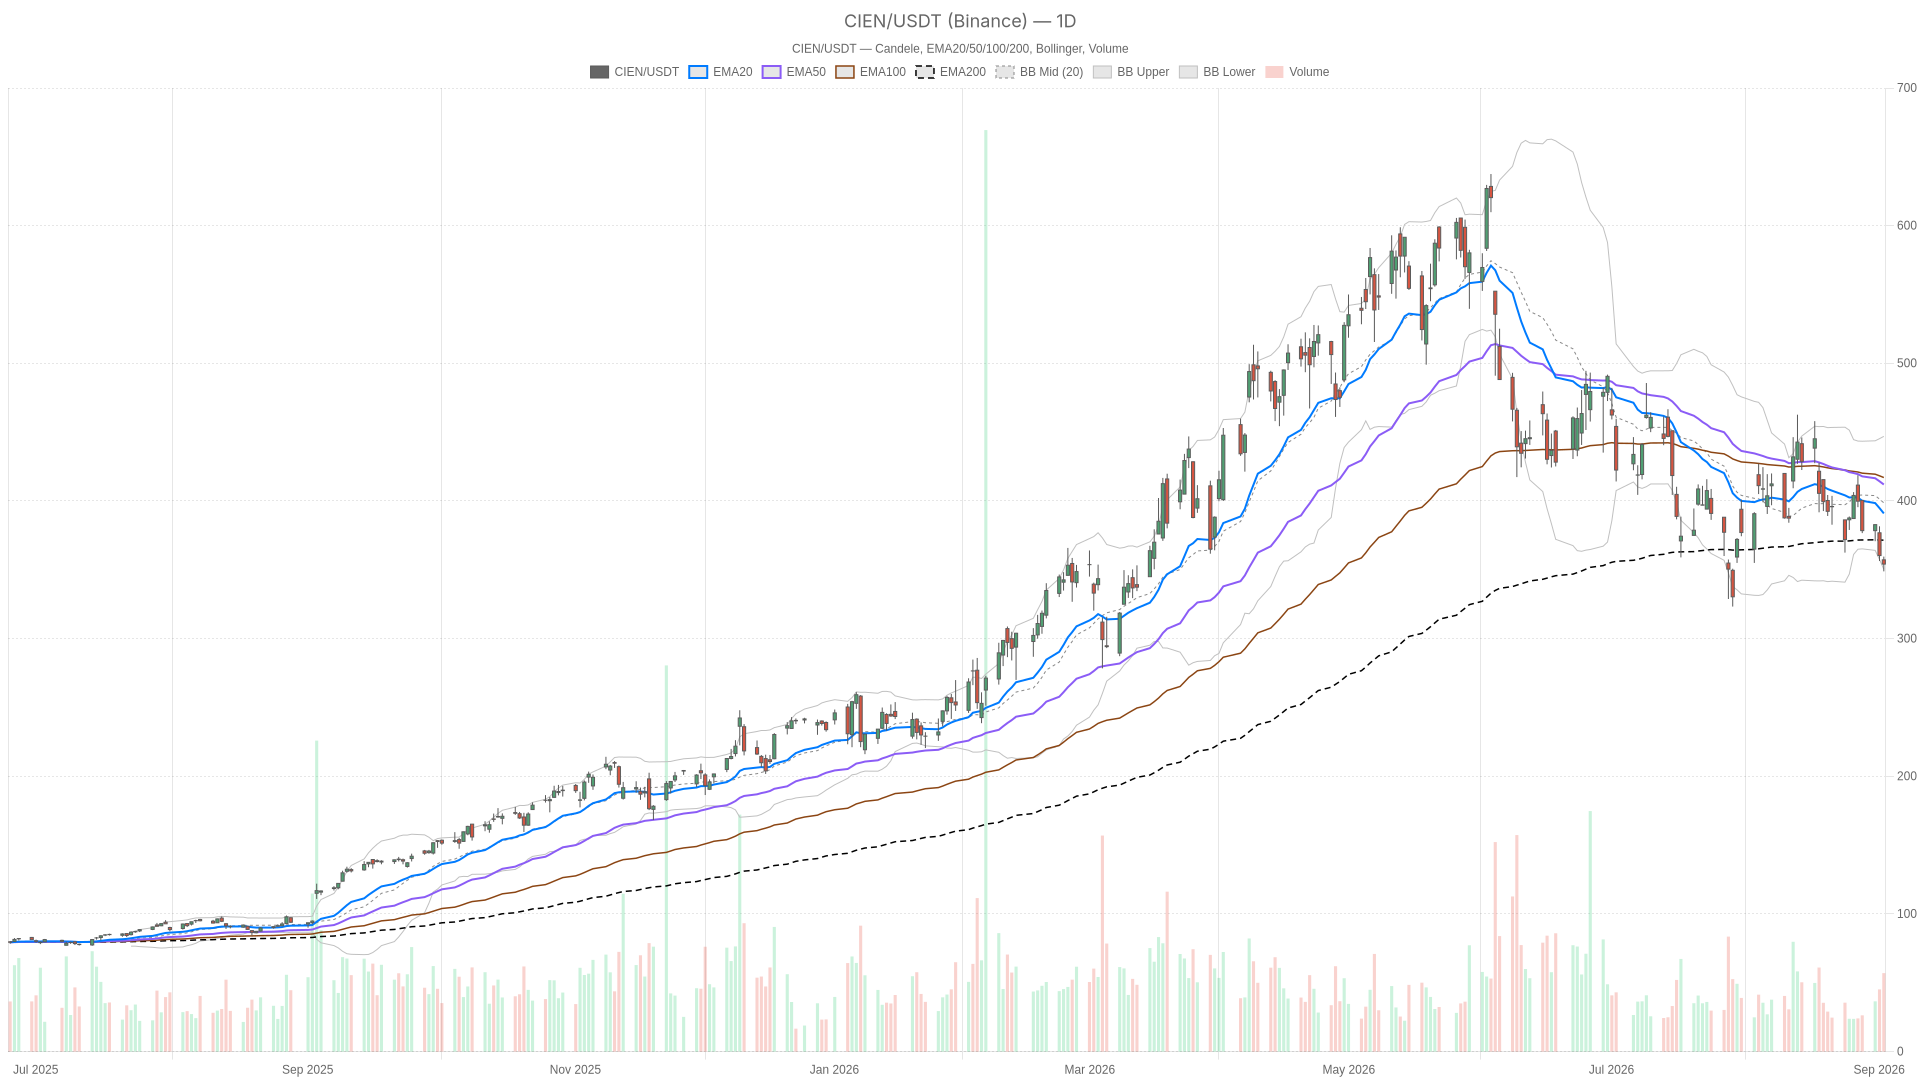
Ciena stock sits at a crossroads ahead of Thursday’s earnings report. The daily chart shows a corrective downtrend, while the shorter-term picture hints at stabilization. This contrast between weak higher-timeframe structure and firming intraday action defines the tension driving the current setup.

Key takeaways
- Ciena stock closed at 354.16, below all three major daily moving averages—EMA20 at 390.96, EMA50 at 411.94, and EMA200 at 371.5.
- Daily RSI14 at 39.08 and a widening negative MACD histogram of -3.9 confirm bearish momentum is still building.
- The 1H chart shows fading selling pressure with a narrowing MACD histogram of just -0.22, hinting at exhaustion.
- The…