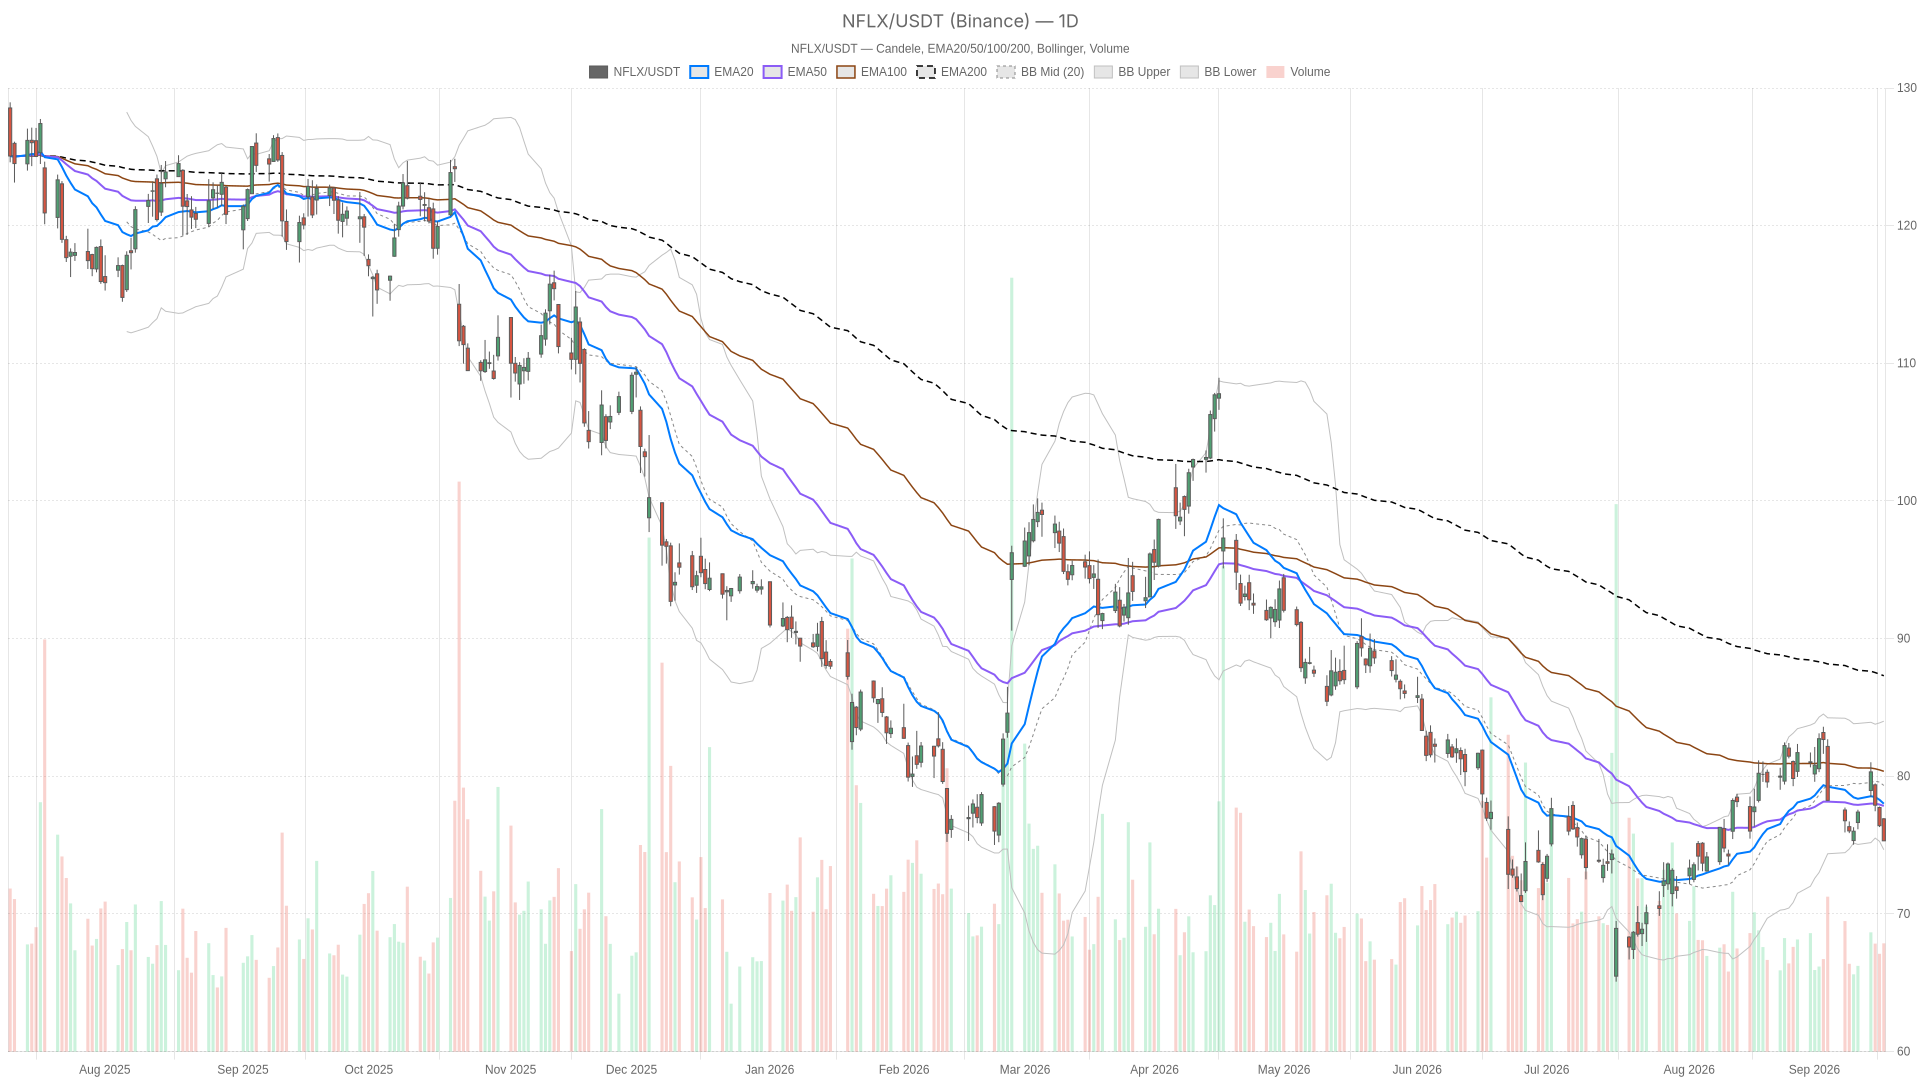
Netflix, Inc. stock closed at $75.31 on September 17, down 1.44% from the prior close of $76.41. Price has broken below every major moving average on the daily chart. The technical picture now leans firmly bearish, though short-term oversold readings complicate the near-term path.

Key takeaways
- NFLX closed at $75.31, below its EMA20 ($78.01), EMA50 ($77.85), and EMA200 ($87.30)—a textbook bearish structure.
- Daily RSI14 at 43.14 remains neutral, meaning sellers still have room to push lower before exhaustion signals appear.
- A Wells Fargo downgrade on a weak content slate followed the stock’s latest leg of selling pressure.
- Hourly RSI14 has fallen to 26.06…