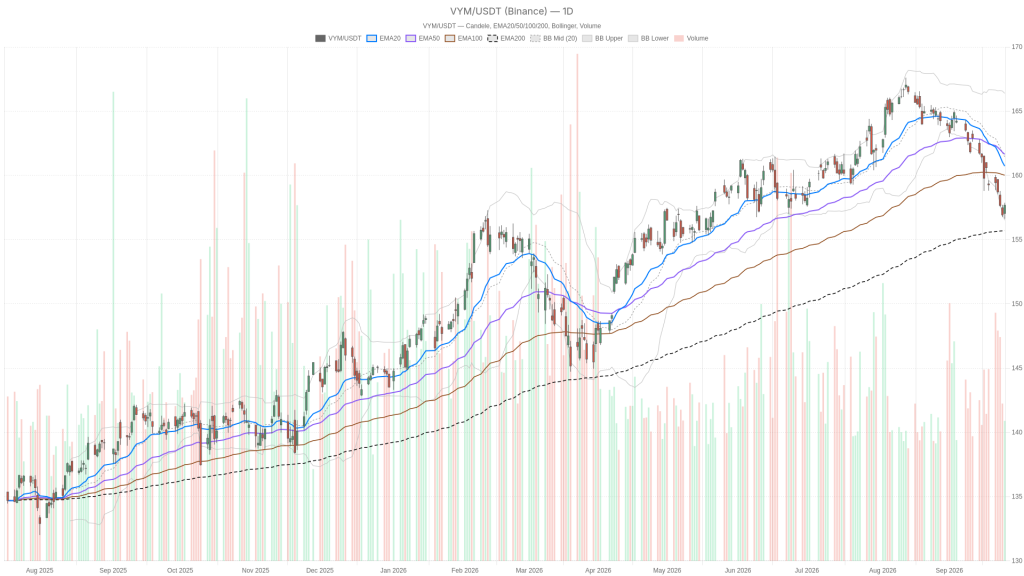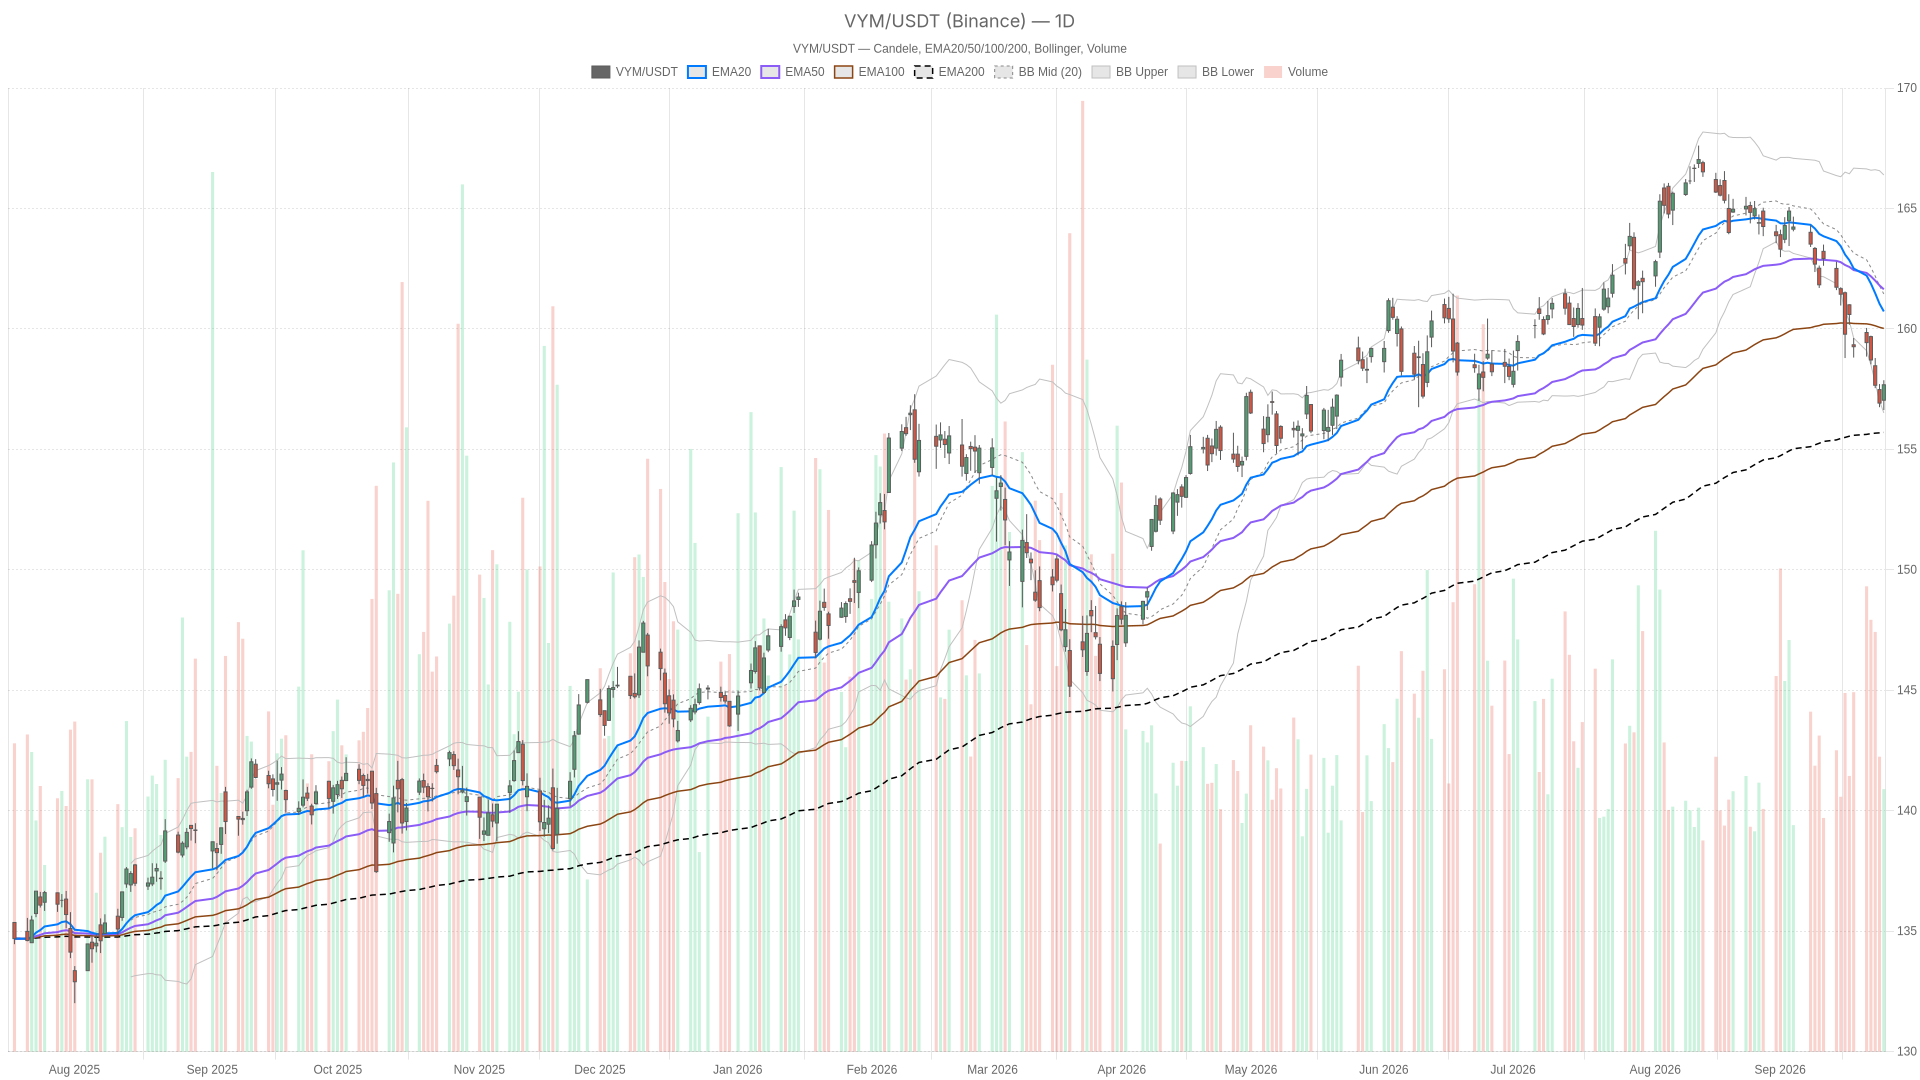
The Vanguard High Dividend Yield ETF stock closed on September 25 at $157.68, up 0.48%. However, beneath that modest gain, daily charts show VYM trading below key moving averages while shorter timeframes hint at stabilization — creating a technically mixed outlook.

Key takeaways
- VYM closed at $157.68, below its 20-day EMA at $160.72 and 50-day EMA at $161.64, but held above the 200-day EMA at $155.70.
- Daily RSI14 at 31.77 places VYM in oversold territory, while MACD remains negative at -1.64.
- The 1-hour chart shows early stabilization with MACD histogram turning slightly positive at 0.14.
- Key support sits at $156.92 (daily S1), with immediate resistance at $158.16…