
Key takeaways
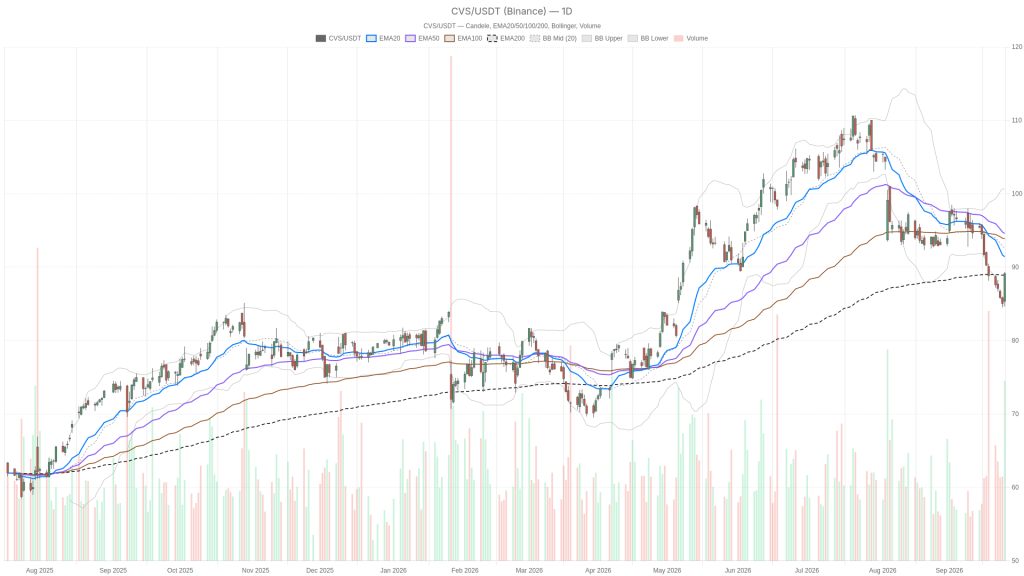
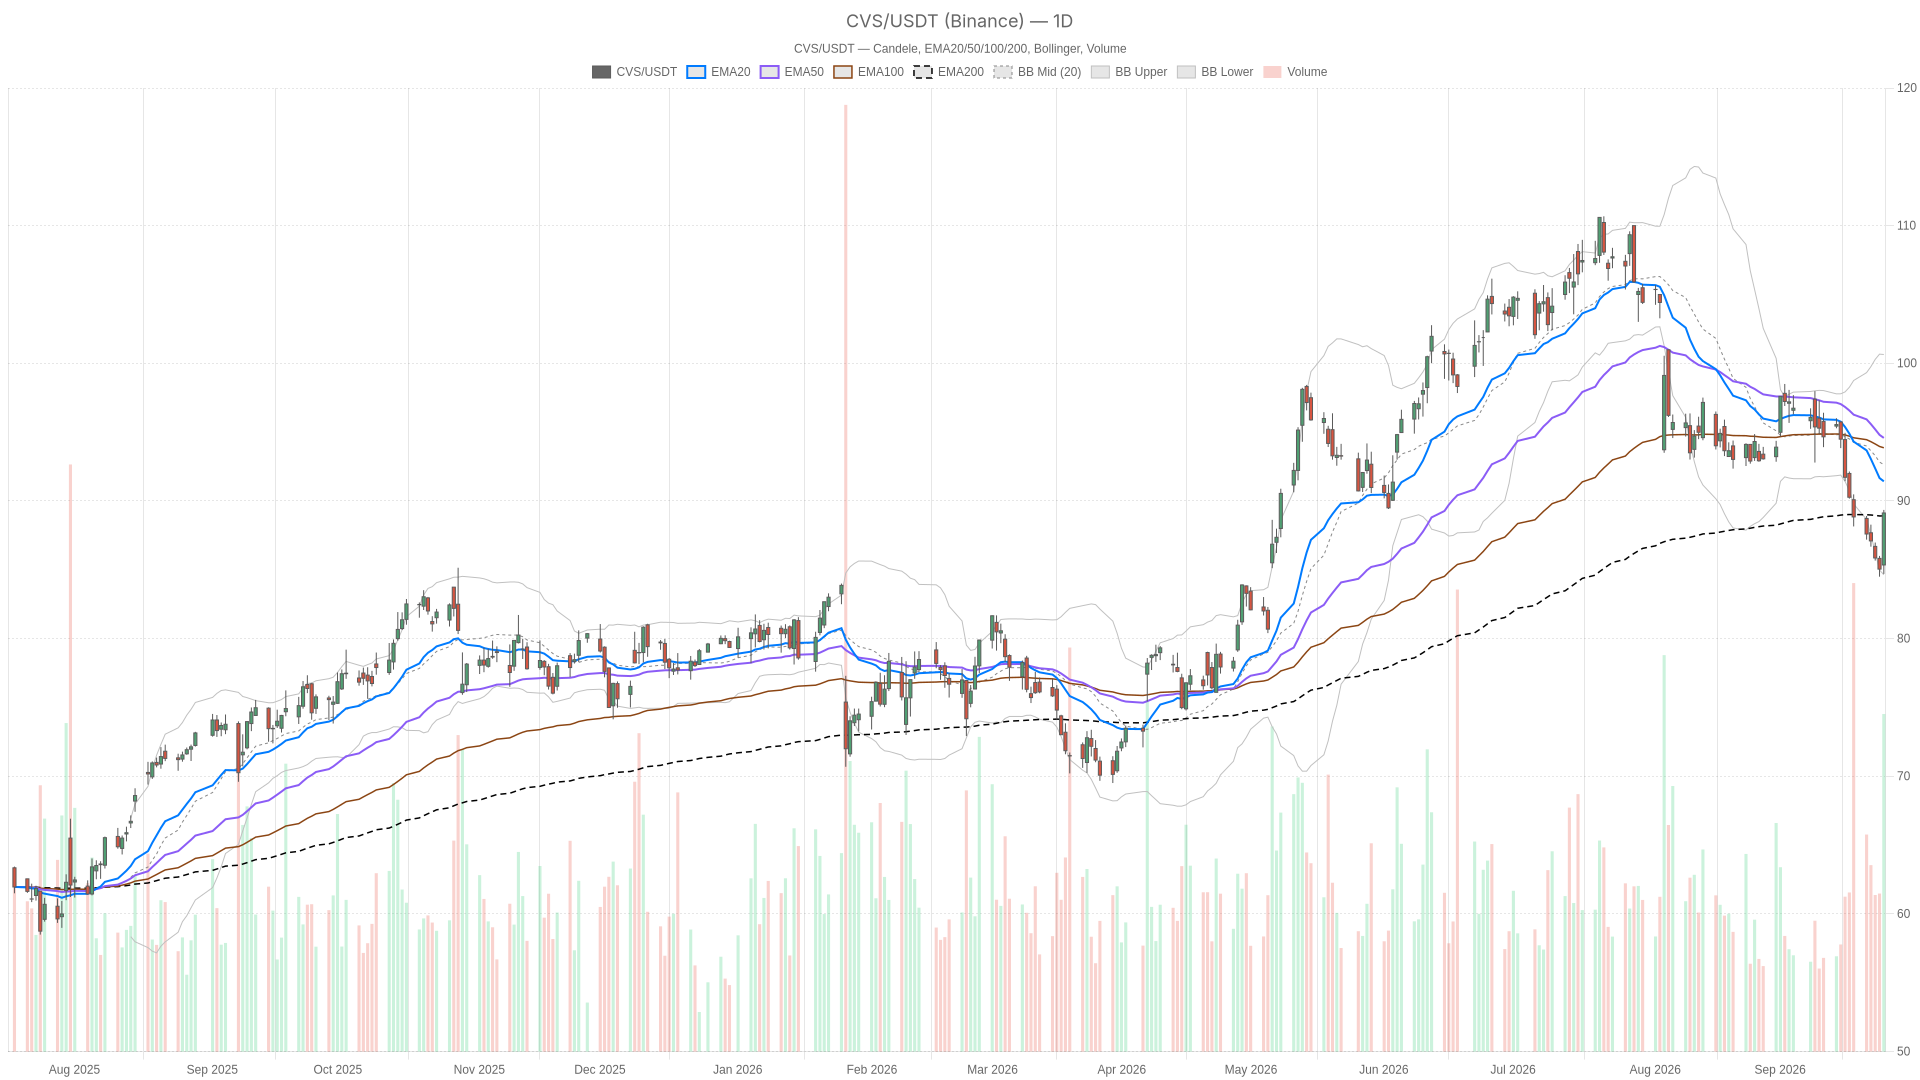
- CVS Health Corporation stock surged 4.8% on September 25, closing at $89.13 and reclaiming the 200-day EMA at $88.91.
- The daily trend remains bearish, with price still below the 20-day EMA at $91.42 and the 50-day EMA at $94.58.
- Daily RSI14 at 40.05 and a negative MACD histogram at -0.55 confirm the broader downtrend is intact.
- Hourly momentum has flipped bullish with a MACD crossover, though RSI14 at 69.03 now nears overbought territory.
- Key levels to watch: R1 resistance at $90.75 and S1 support at $86.10, framing the immediate decision zone.
CVS Health Corporation stock surged 4.8% on September 25, closing at $89.13 after eight consecutive losing…