logo
  • Home
  • News
Menu

The Buffett Indicator

Home / Stock Analysis / The Buffett Indicator
Article feature image

The Buffett Indicator

12 Sep Stock Analysis

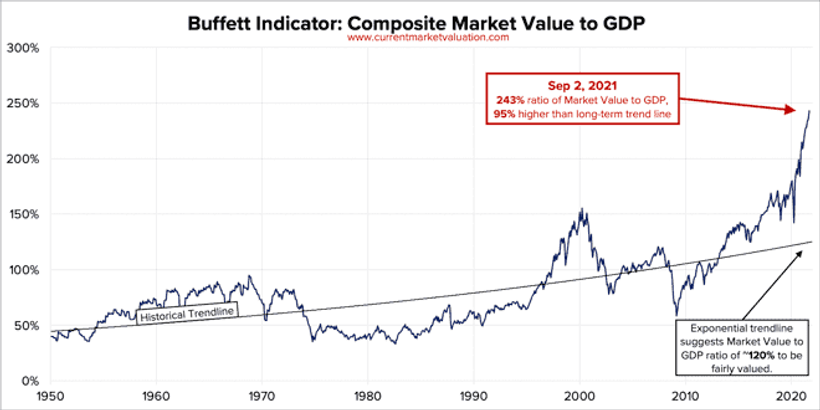
The Buffett Indicator is the ratio of total United States stock market valuation to GDP. As of September 2, 2021 we calculate the Buffett Indicator as:
Aggregate US Market Value: $55.8T
Annualized GDP: $22.9T
Buffett Indicator:
$55.8T ÷ $22.9T
=
243%
…

Click here to view the original article.

Tags:
Currentmarketvaluation.com, Global
Facebook Google+ Twitter Pinterest
  Previous
Next  

Related Posts

Adani_enterprises_rights_issue_1764126670400_1764126670569.JPG
+

Adani Enterprises rights issue opens: Price, entitlement ratio, other important details in 10 points

26 Nov Stock Analysis
eng-left-mc-logo-600x60.png
+

Stock and Share Market News, Economy and Finance News, Sensex, Nifty, Global Market, NSE, BSE Live IPO News

26 Nov Stock Analysis

recent post

  • Adani_enterprises_rights_issue_1764126670400_1764126670569.JPG

    Adani Enterprises rights issue opens: Price,

    Nov 26 2025
  • 6926808a09ac6576a356476d_69268089364a5abdb119b430_lastImage.png

    What’s Next for Crypto Trading in

    Nov 26 2025
  • eng-left-mc-logo-600x60.png

    Stock and Share Market News, Economy

    Nov 26 2025
  • 112625-japan-crypto.jpeg

    Japan Moves to Boost Crypto Safety

    Nov 26 2025
  • eicher-motors-stock-price-live-updates-26-nov-2025.jpg

    Eicher Motors Share Price Live Updates:

    Nov 26 2025

Categories

  • Business
  • Crypto News
  • Investing Strategy
  • People
  • Stock Analysis

©2019.  All Rights Reserved.