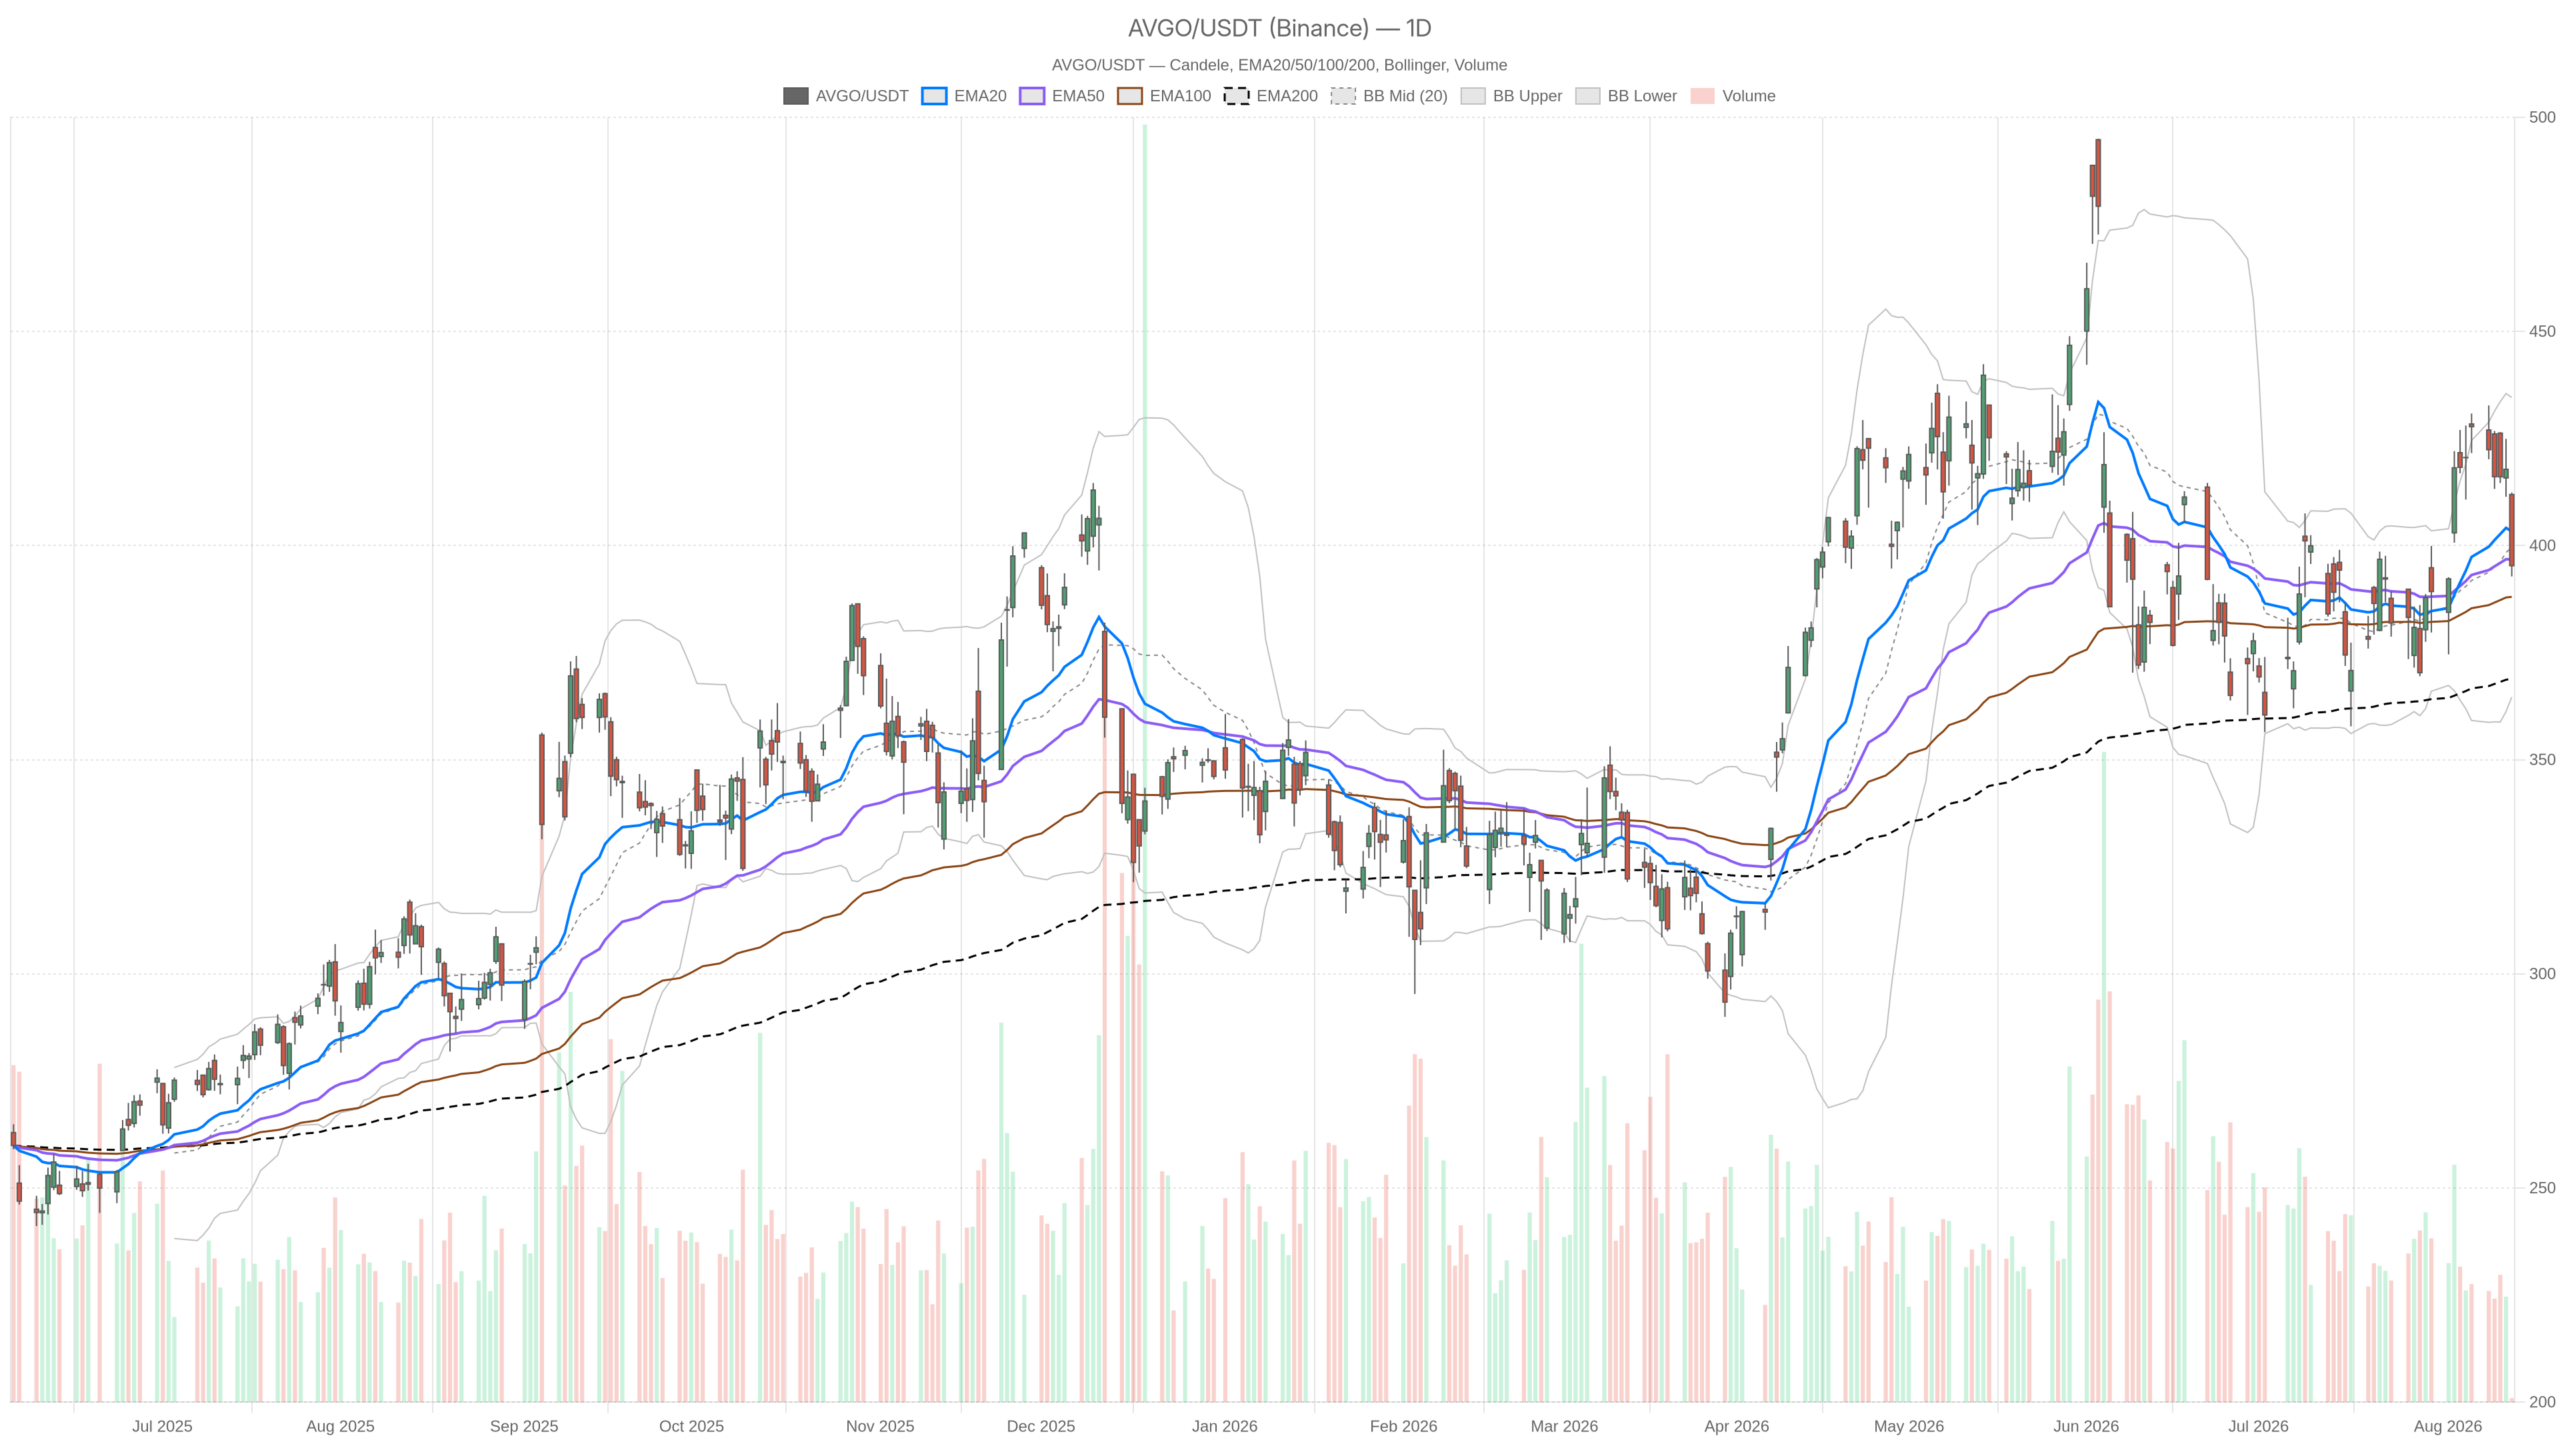
Broadcom Inc. stock suffered one of its most violent single-session drops in months, gapping from an open near $411.92 to a close of $395.31. The roughly $20 range far exceeded the daily ATR14 of $16.53, confirming a genuine volatility event. Is this a corrective pullback or the start of a deeper trend shift?
Key takeaways
- AVGO gapped down sharply, closing at $395.31 after touching an intraday low of $392.80.
- The daily chart remains structurally intact, with price still well above the EMA200 at $368.94.
- Hourly momentum turned deeply oversold, with RSI14 dropping to 25.09 and MACD accelerating downward.
- A bullish recovery requires reclaiming the daily EMA50 near $396.76…