
Shares of Zee Ent. rise as Nifty gains
On the technical charts, the 200-day moving average of the stock stood at Rs 224.79.

On the technical charts, the 200-day moving average of the stock stood at Rs 224.79.

On the technical charts, the 200-day moving average of the stock stood at Rs 269.45.

The initial stake sale of PB Fintech was open for subscription between November 1-3. The fintech startup raised Rs 5,625 crore…

Every investor in Tribune Resources Limited ( ASX:TBR ) should be aware of the most powerful shareholder groups…

Celltrion Inc.’s shares rallied Monday after the European Commission granted the South Korean biotech firm approval to market…
Standalone revenues at Rs 8,453.4 crore declined 10 percent from Rs 9,367 crore recorded in the corresponding quarter last year….

India Inc sustained momentum in revenue and profit for the September quarter helped by a gradual recovery in economic activities….
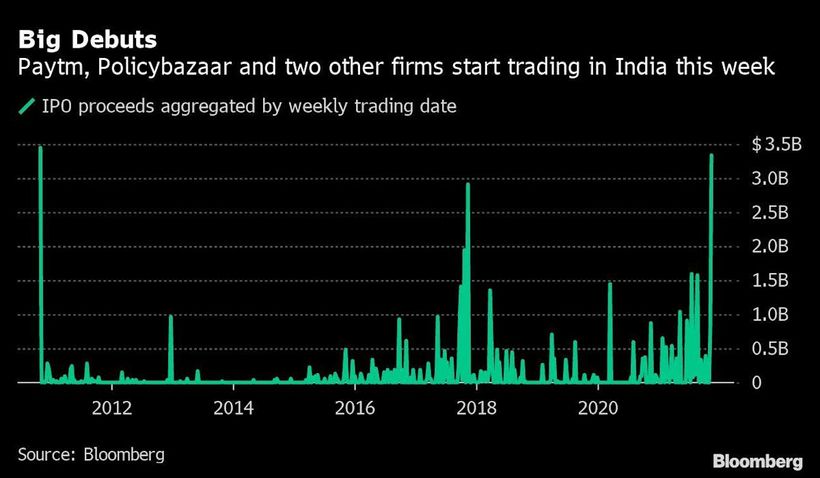
(Bloomberg) — Investors looking at newly listed shares in India will be busy this week. Most Read from BloombergWhat Designers…
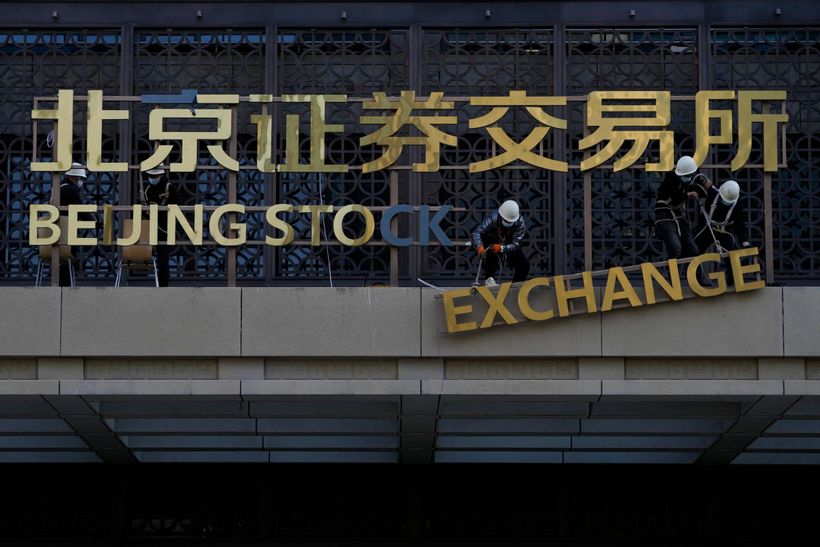
A stock exchange set up in the Chinese capital to serve entrepreneurs opened trading Monday with 81 companies amid a crackdown…

Samsung Electronics (005930.KS) vice chairman Jay Y. Lee is visiting North America in his first high-profile trip after serving…