What Drives Stock Price Fluctuations? Expected Cash Flows Versus Expected Returns

This figure titled “US Corporate Sector Enterprise Value and Cash Flows, 1929–2023” shows a time series chart from 1929 to 2023 with two metrics plotted on separate y-axes.  The blue line (left y-axis) shows the "Ratio of enterprise value to corporate gross value added" ranging from 0 to 6.00. The gray line (right y-axis) shows the "Ratio of cash flows to corporate gross value added" ranging from 0 to 0.16. The blue line representing the "Ratio of enterprise value to corporate gross value added"  •	Shows high volatility during the 1930s-40s as it starts around 3.00 in 1929 and falls to under 1.50 by 1940, followed by moderate stability in the 1950s.  •	After a slight recovery in the 50s, and 60s, peaking at around 2.30, the line experiences a sustained low period during the 1970s and early 1990s at about 1. •	Demonstrates consistent growth from the mid-1990s onward, reaching a peak value above 4.50 in 2019 The gray line representing the "Ratio of cash flows to corporate gross value added"  •	Exhibits greater volatility throughout the entire time period as it starts at 0.14 in 1929 and declines to about 0.02 by the mid 1940s. •	Generally follows similar long-term trends as the blue line, but with more pronounced fluctuations, ranging between 0.02 and 0.08 from the 1950s until 2000. •	Post 2000, there is a consistent increase, reaching highs around the mid to late 2010s, with values exceeding 0.12 Source: Researchers' calculations using data from the Integrated Macroeconomic Accounts for the United States.

One leading view in finance is that the high volatility of the stock market valuations of US corporations is driven by large fluctuations in expected returns. However, if expected returns are so volatile, why is the capital stock of the same US corporations relatively stable? In Reconciling Macroeconomics and Finance for the US Corporate Sector: 1929 to Present (NBER Working Paper 33459), researchers Andrew AtkesonJonathan Heathcote, and Fabrizio Perri seek to reconcile these seemingly discordant observations.

Fluctuations in expected cash flows, not expected returns, are the primary drivers of volatility in US corporate valuations.

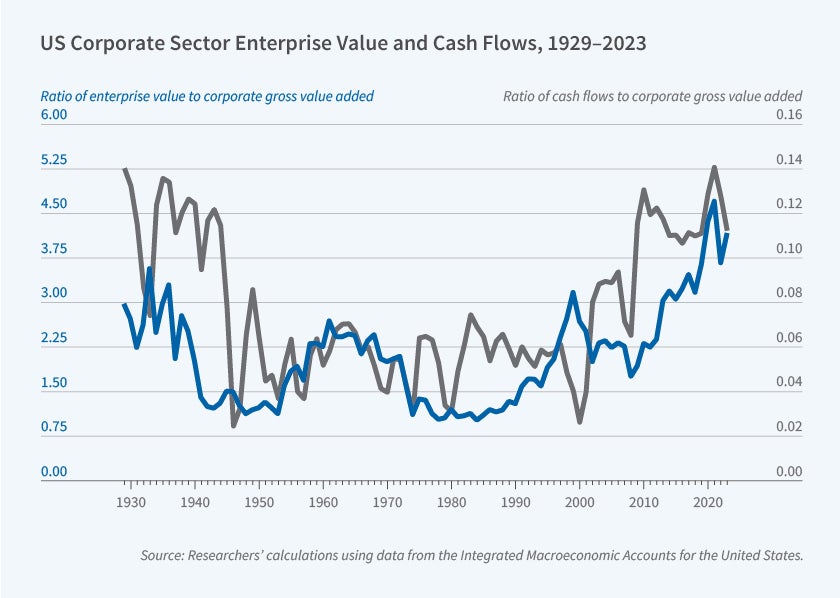
The researchers analyze the Integrated Macroeconomic Accounts (IMA) for the United…

Source link