Watch These Nvidia Price Levels as Stock Slips Further Into Correction Territory
Key Takeaways
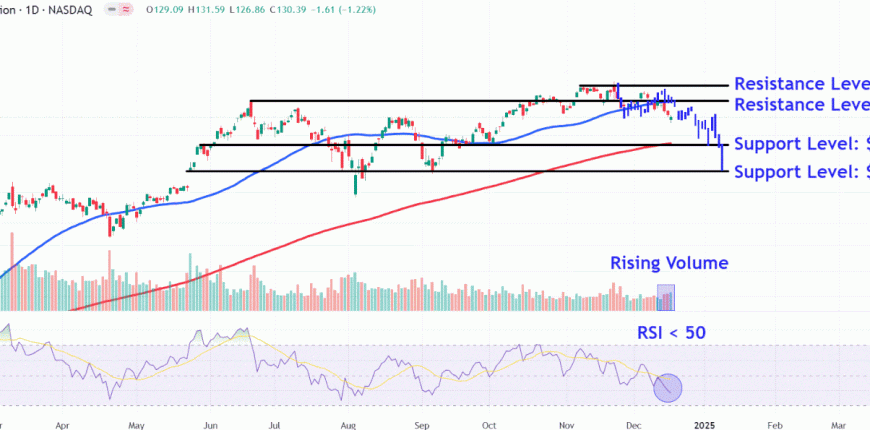
- Nvidia shares fell for the fourth straight session on Tuesday, extending their slide into a technical correction as the stock is down 15% from last month’s record high.
- After setting a record high, the stock traded mostly sideways before falling below the 50-day moving average late last week. potentially setting the stage for further consolidation.
- Investors should watch key support levels on Nvidia’s chart around $115 and $102, while also monitoring important resistance levels near $140 and $150.
Nvidia (NVDA) shares fell for the fourth straight session on Tuesday, extending their slide into a technical correction as the stock is down 15% from last month’s record high.
While analysts remain bullish on the company’s…


