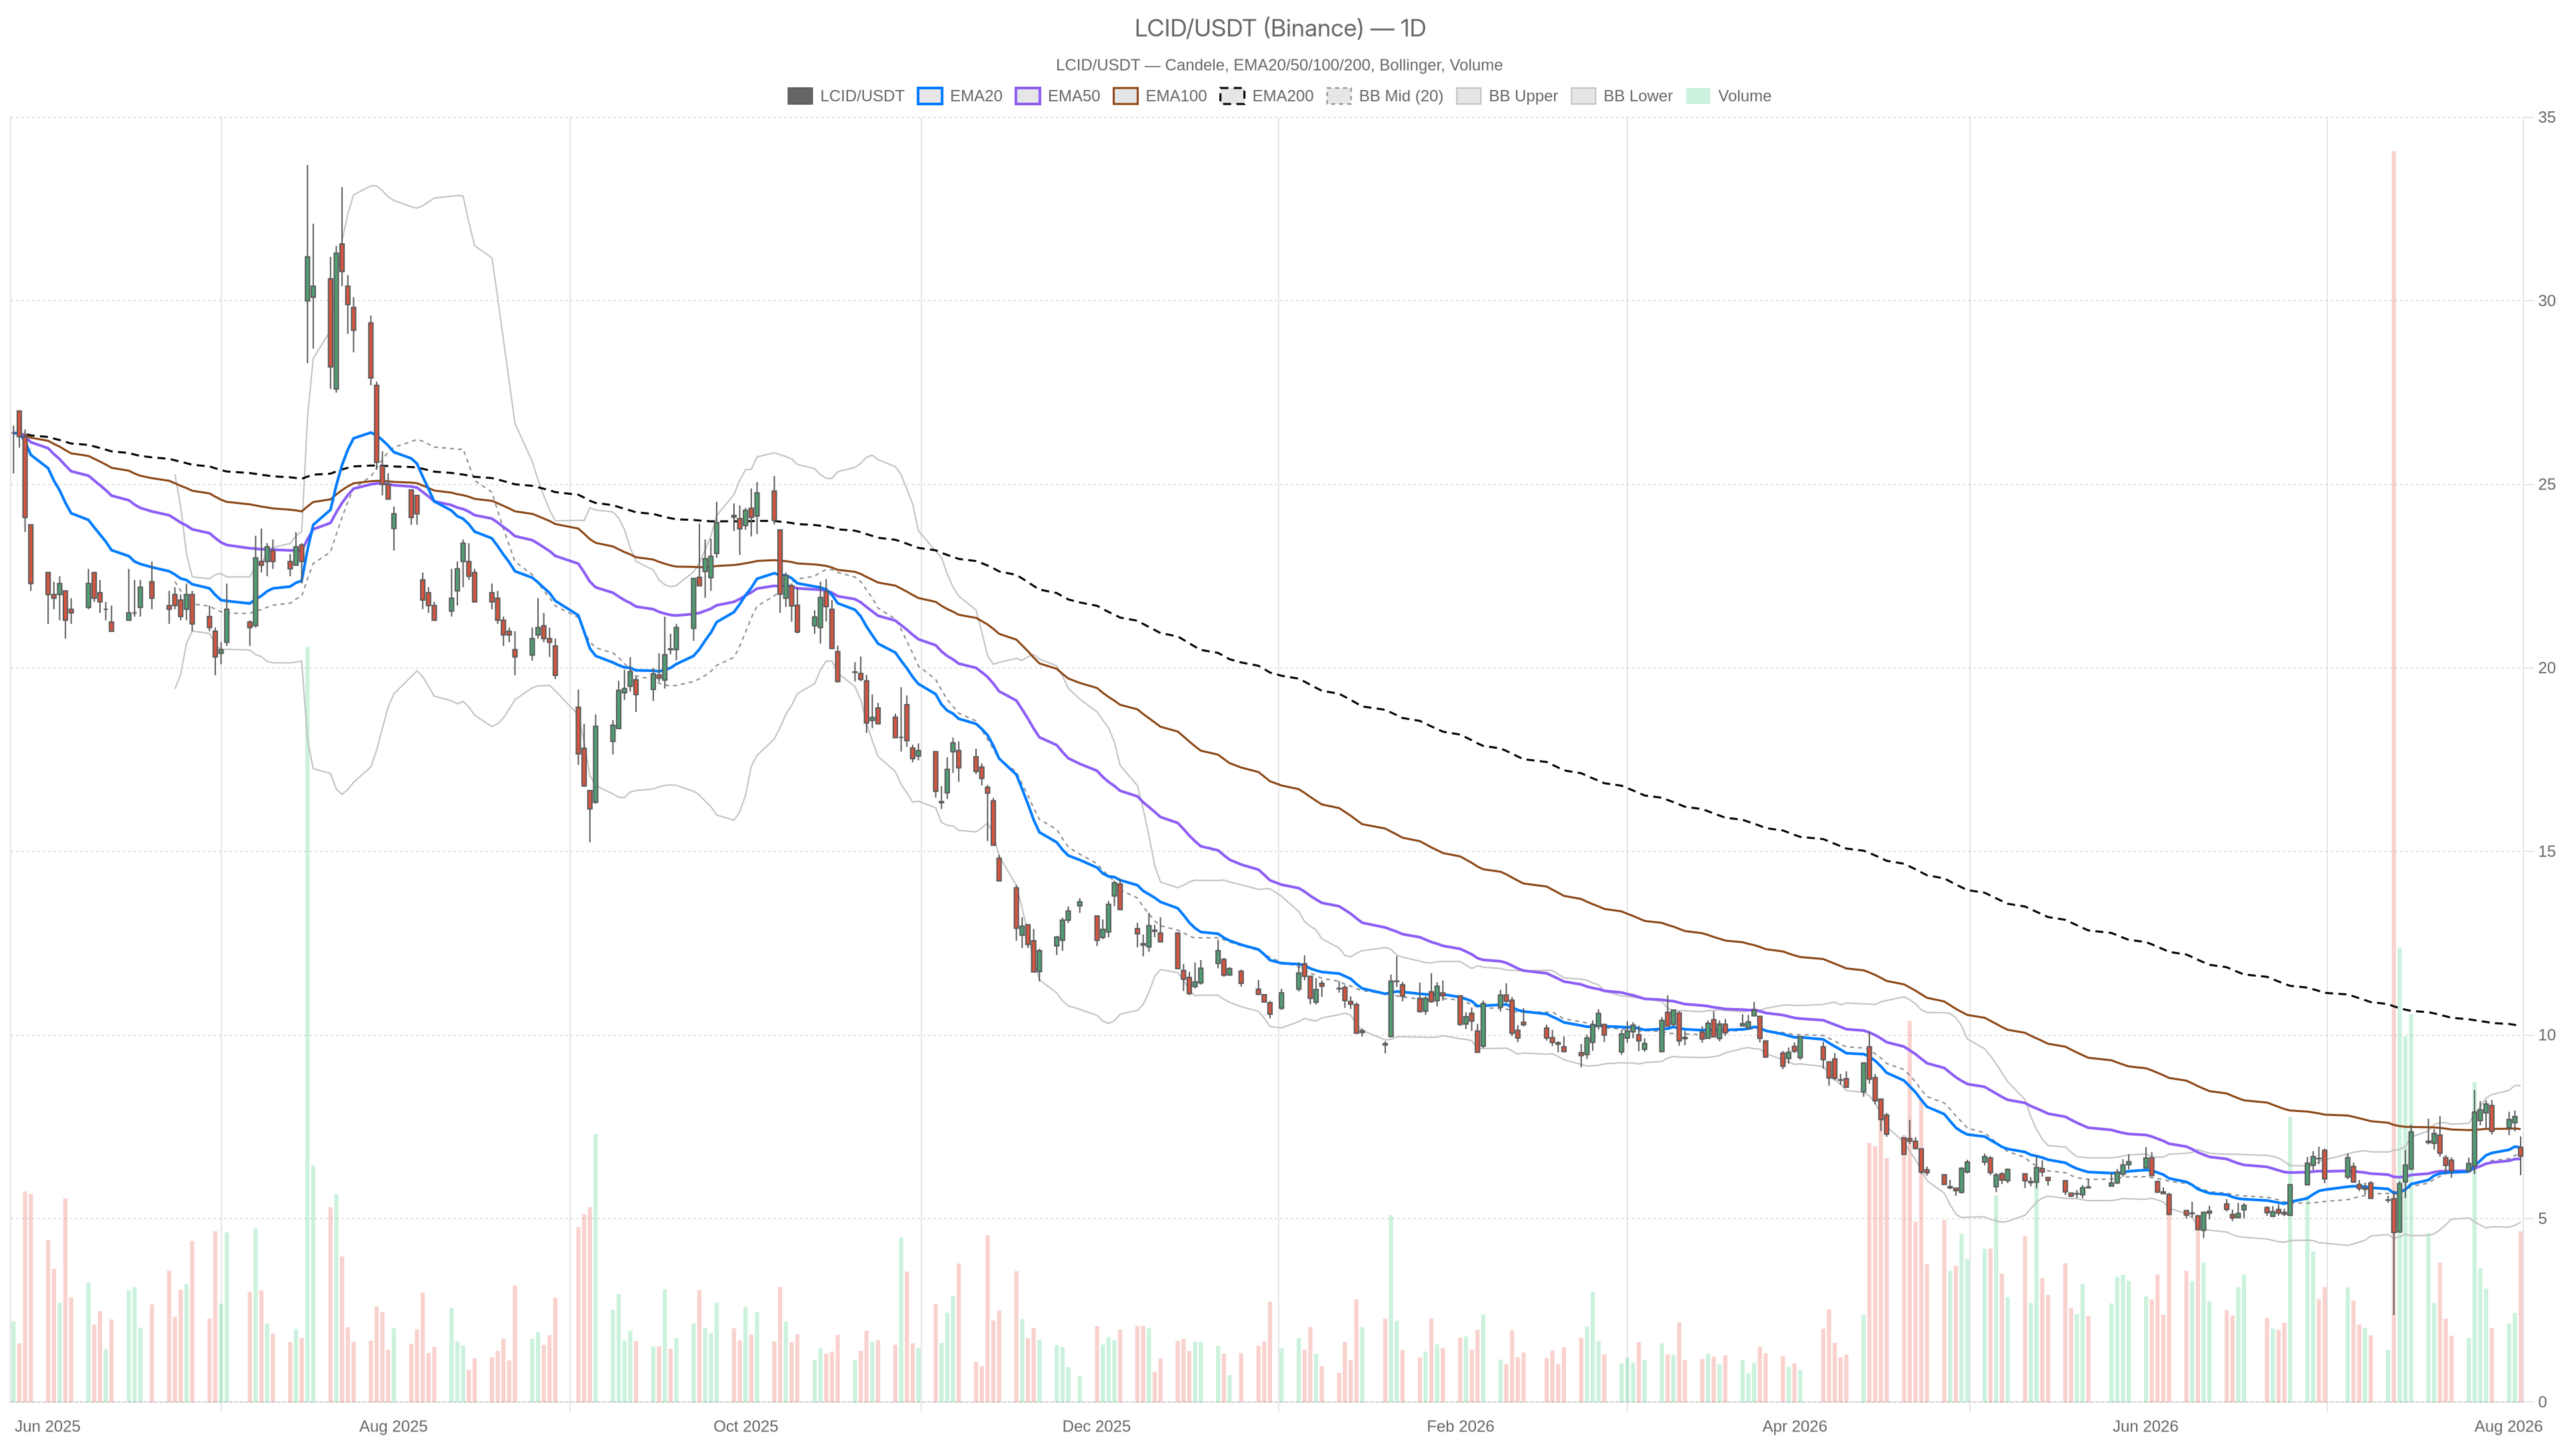
Lucid stock is trying to find its footing after a violent earnings-driven selloff, with two conflicting timeframes now at play. The daily chart shows tentative stabilization, while the hourly structure flashes renewed weakness. Combined with a sharp operational reset from management, this tension demands caution over conviction.
Key takeaways
- LCID closed at $6.70 on August 5 with an intraday range of $6.18 to $7.24
- Daily RSI14 sits at 49.4 — neutral and reflecting indecision across the primary timeframe
- Price trades more than 34% below the EMA200 at $10.24, confirming a structural downtrend
- Hourly MACD histogram at -0.11 signals active selling pressure on the lower…