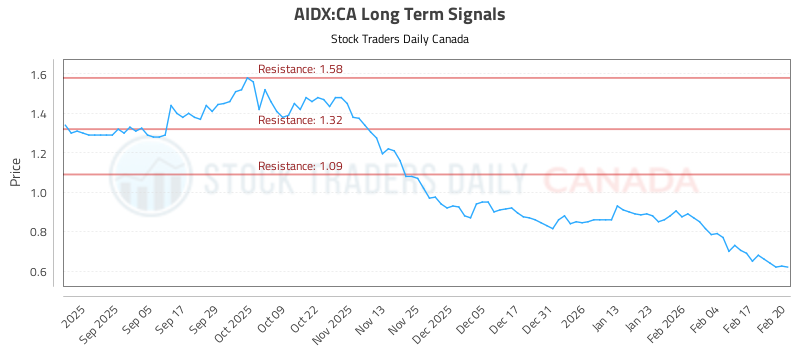
Technical Momentum and Indicator Overview
The technical landscape for Sagility reveals a complex but increasingly positive picture. The Moving Average Convergence Divergence (MACD) indicator on the weekly chart signals bullish momentum, suggesting that the stock’s short-term price movements are gaining strength relative to its longer-term trend. However, the monthly MACD does not currently provide a clear directional signal, indicating that longer-term momentum remains less definitive.
Relative Strength Index (RSI) readings on both weekly and monthly timeframes do not present a distinct signal, implying that the stock is neither overbought nor oversold at present. This neutral RSI stance suggests that Sagility’s price movements are…


