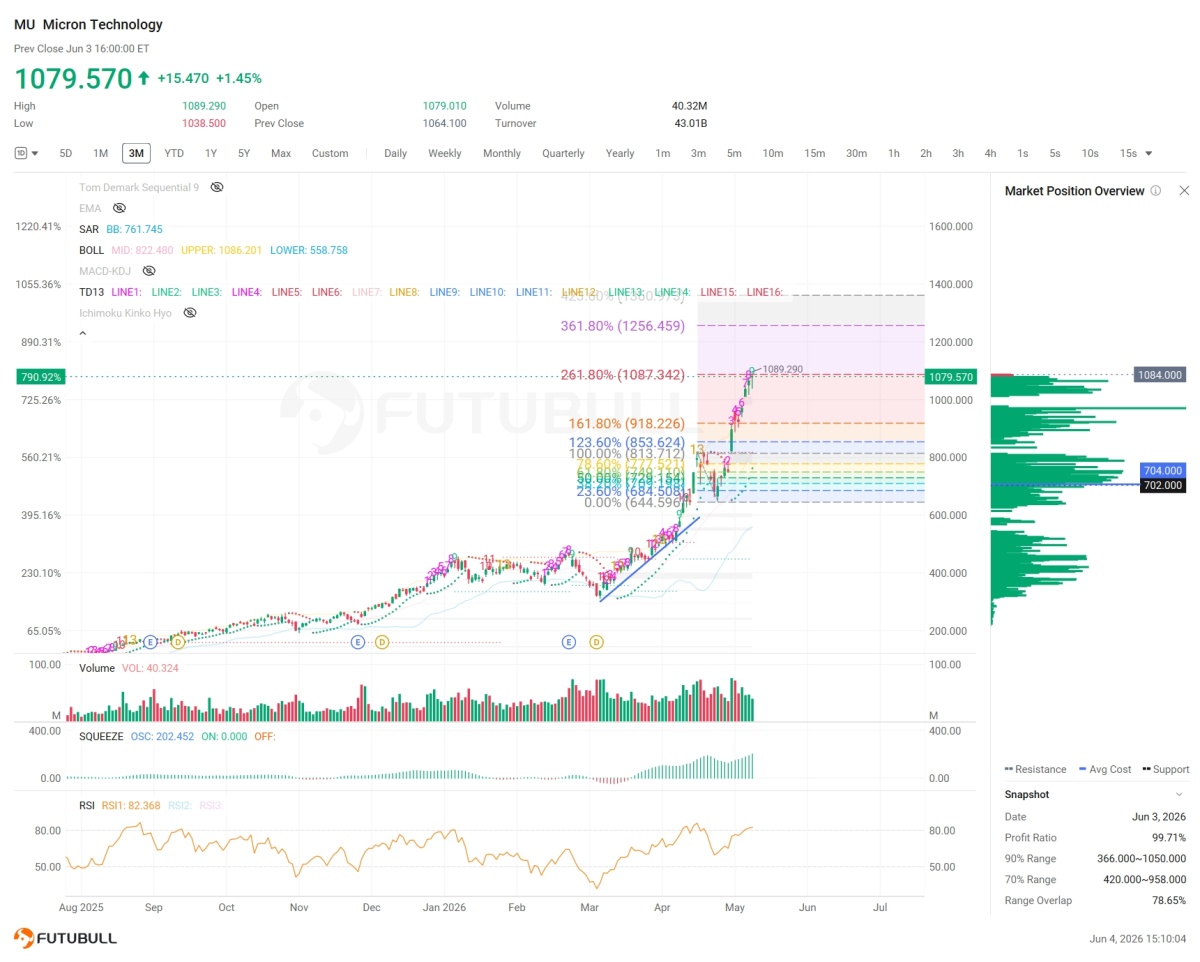
Measured from the May 11 local peak of $813 to the May 19 trough of $644, the 261.8% Fibonacci extension lands at $1,087.34. Micron’s high yesterday was $1,089.29 — a $1.95 overshoot before the stock rolled over. Markets rarely telegraph exhaustion this cleanly, especially for a stock so explosive, but Micron seems to be respecting its own geometry here.
The setup is simple. The 261.8% extension served as resistance. The next Fibonacci level below — the 161.8% at $918.23 — happens to coincide almost exactly with where the 10-day moving average currently sits, around $920. That confluence of Fibonacci support and a rising short-term average makes it a logical magnet for any mean-reversion move. The measured pullback from today’s…