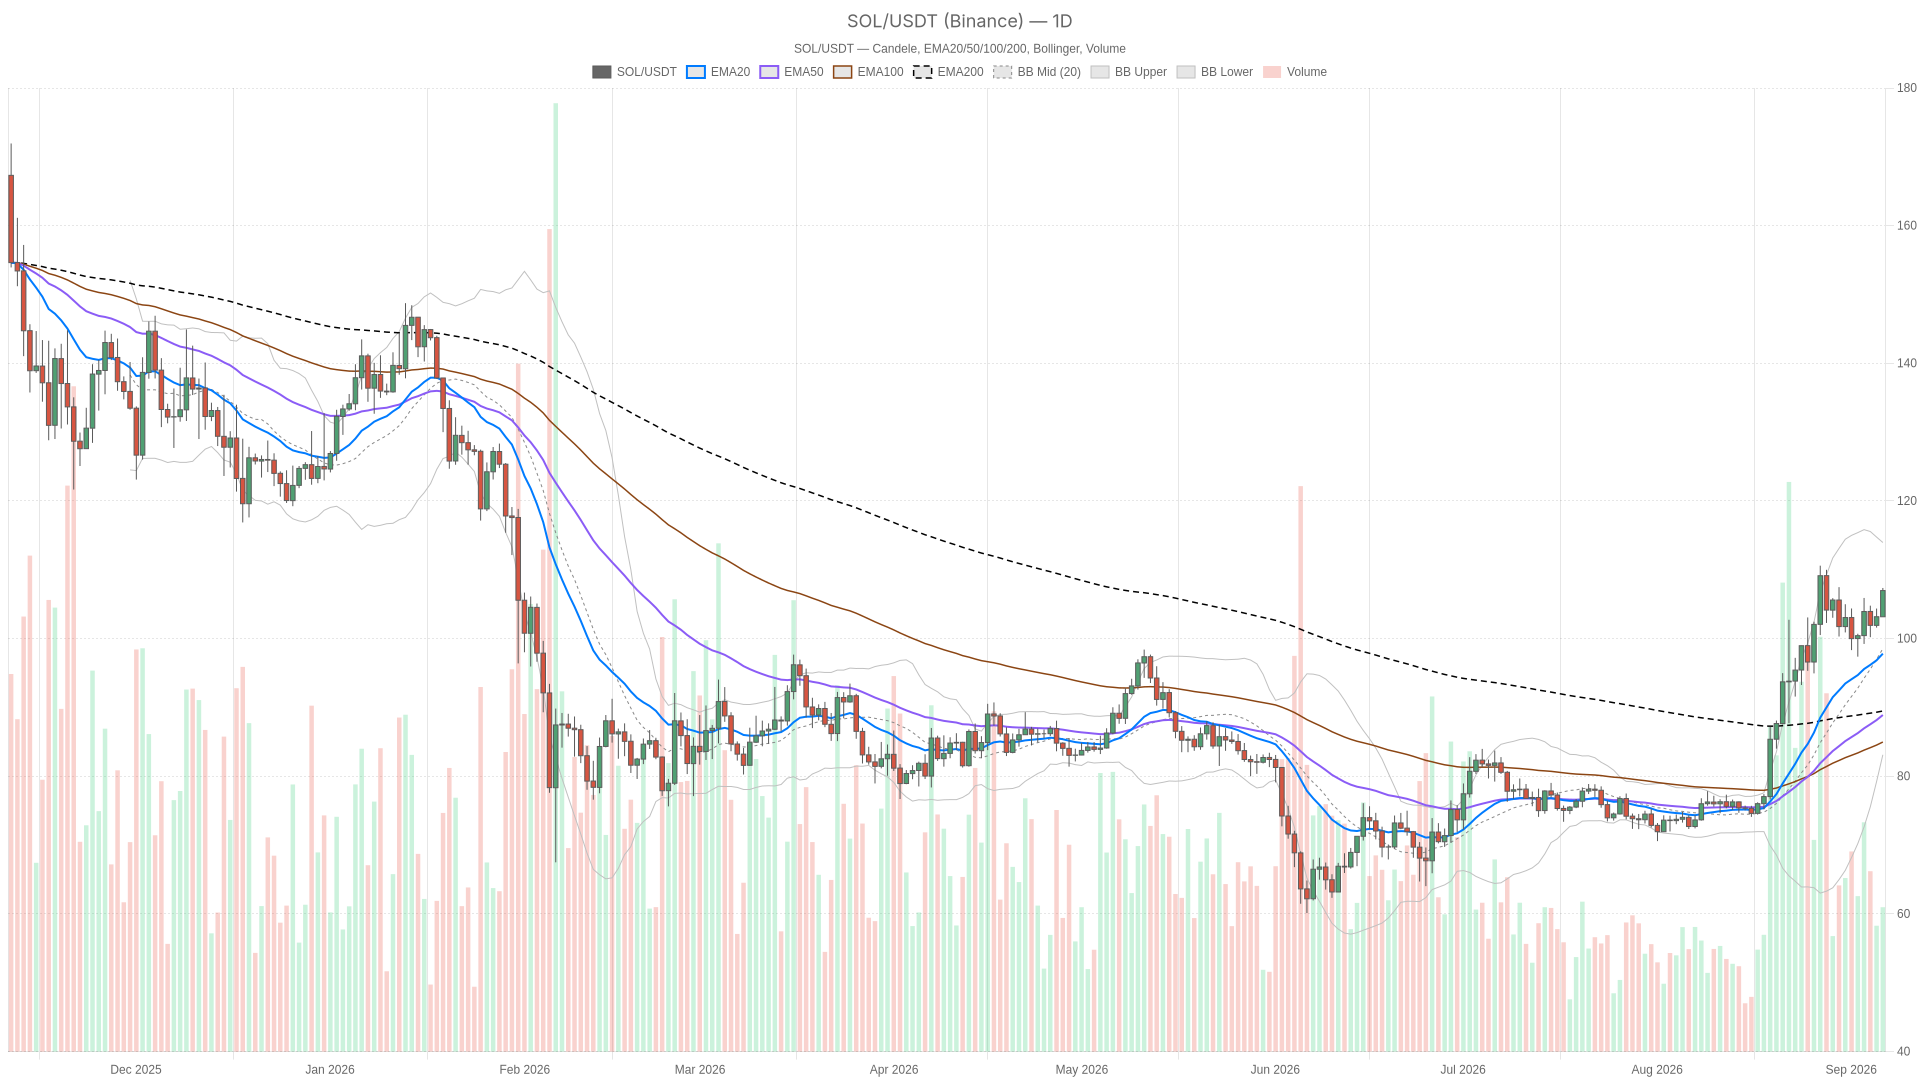
Trading near $106.98 on September 6, 2026, Solana crypto sits at a decisive resistance shelf that will likely determine the next directional move. The daily chart shows price stretched above every major moving average, yet momentum gauges are beginning to fade exactly where conviction is most needed.

Key takeaways
- SOL holds comfortably above its 50 and 200-day EMAs, maintaining a textbook bullish stack on the daily timeframe.
- Daily RSI14 at 68.52 flirts with overbought territory while the MACD histogram turns negative at -0.22, signalling decelerating momentum.
- The 107–108.50 resistance band — a confluence of daily R1 and short-term pivots — is the critical…