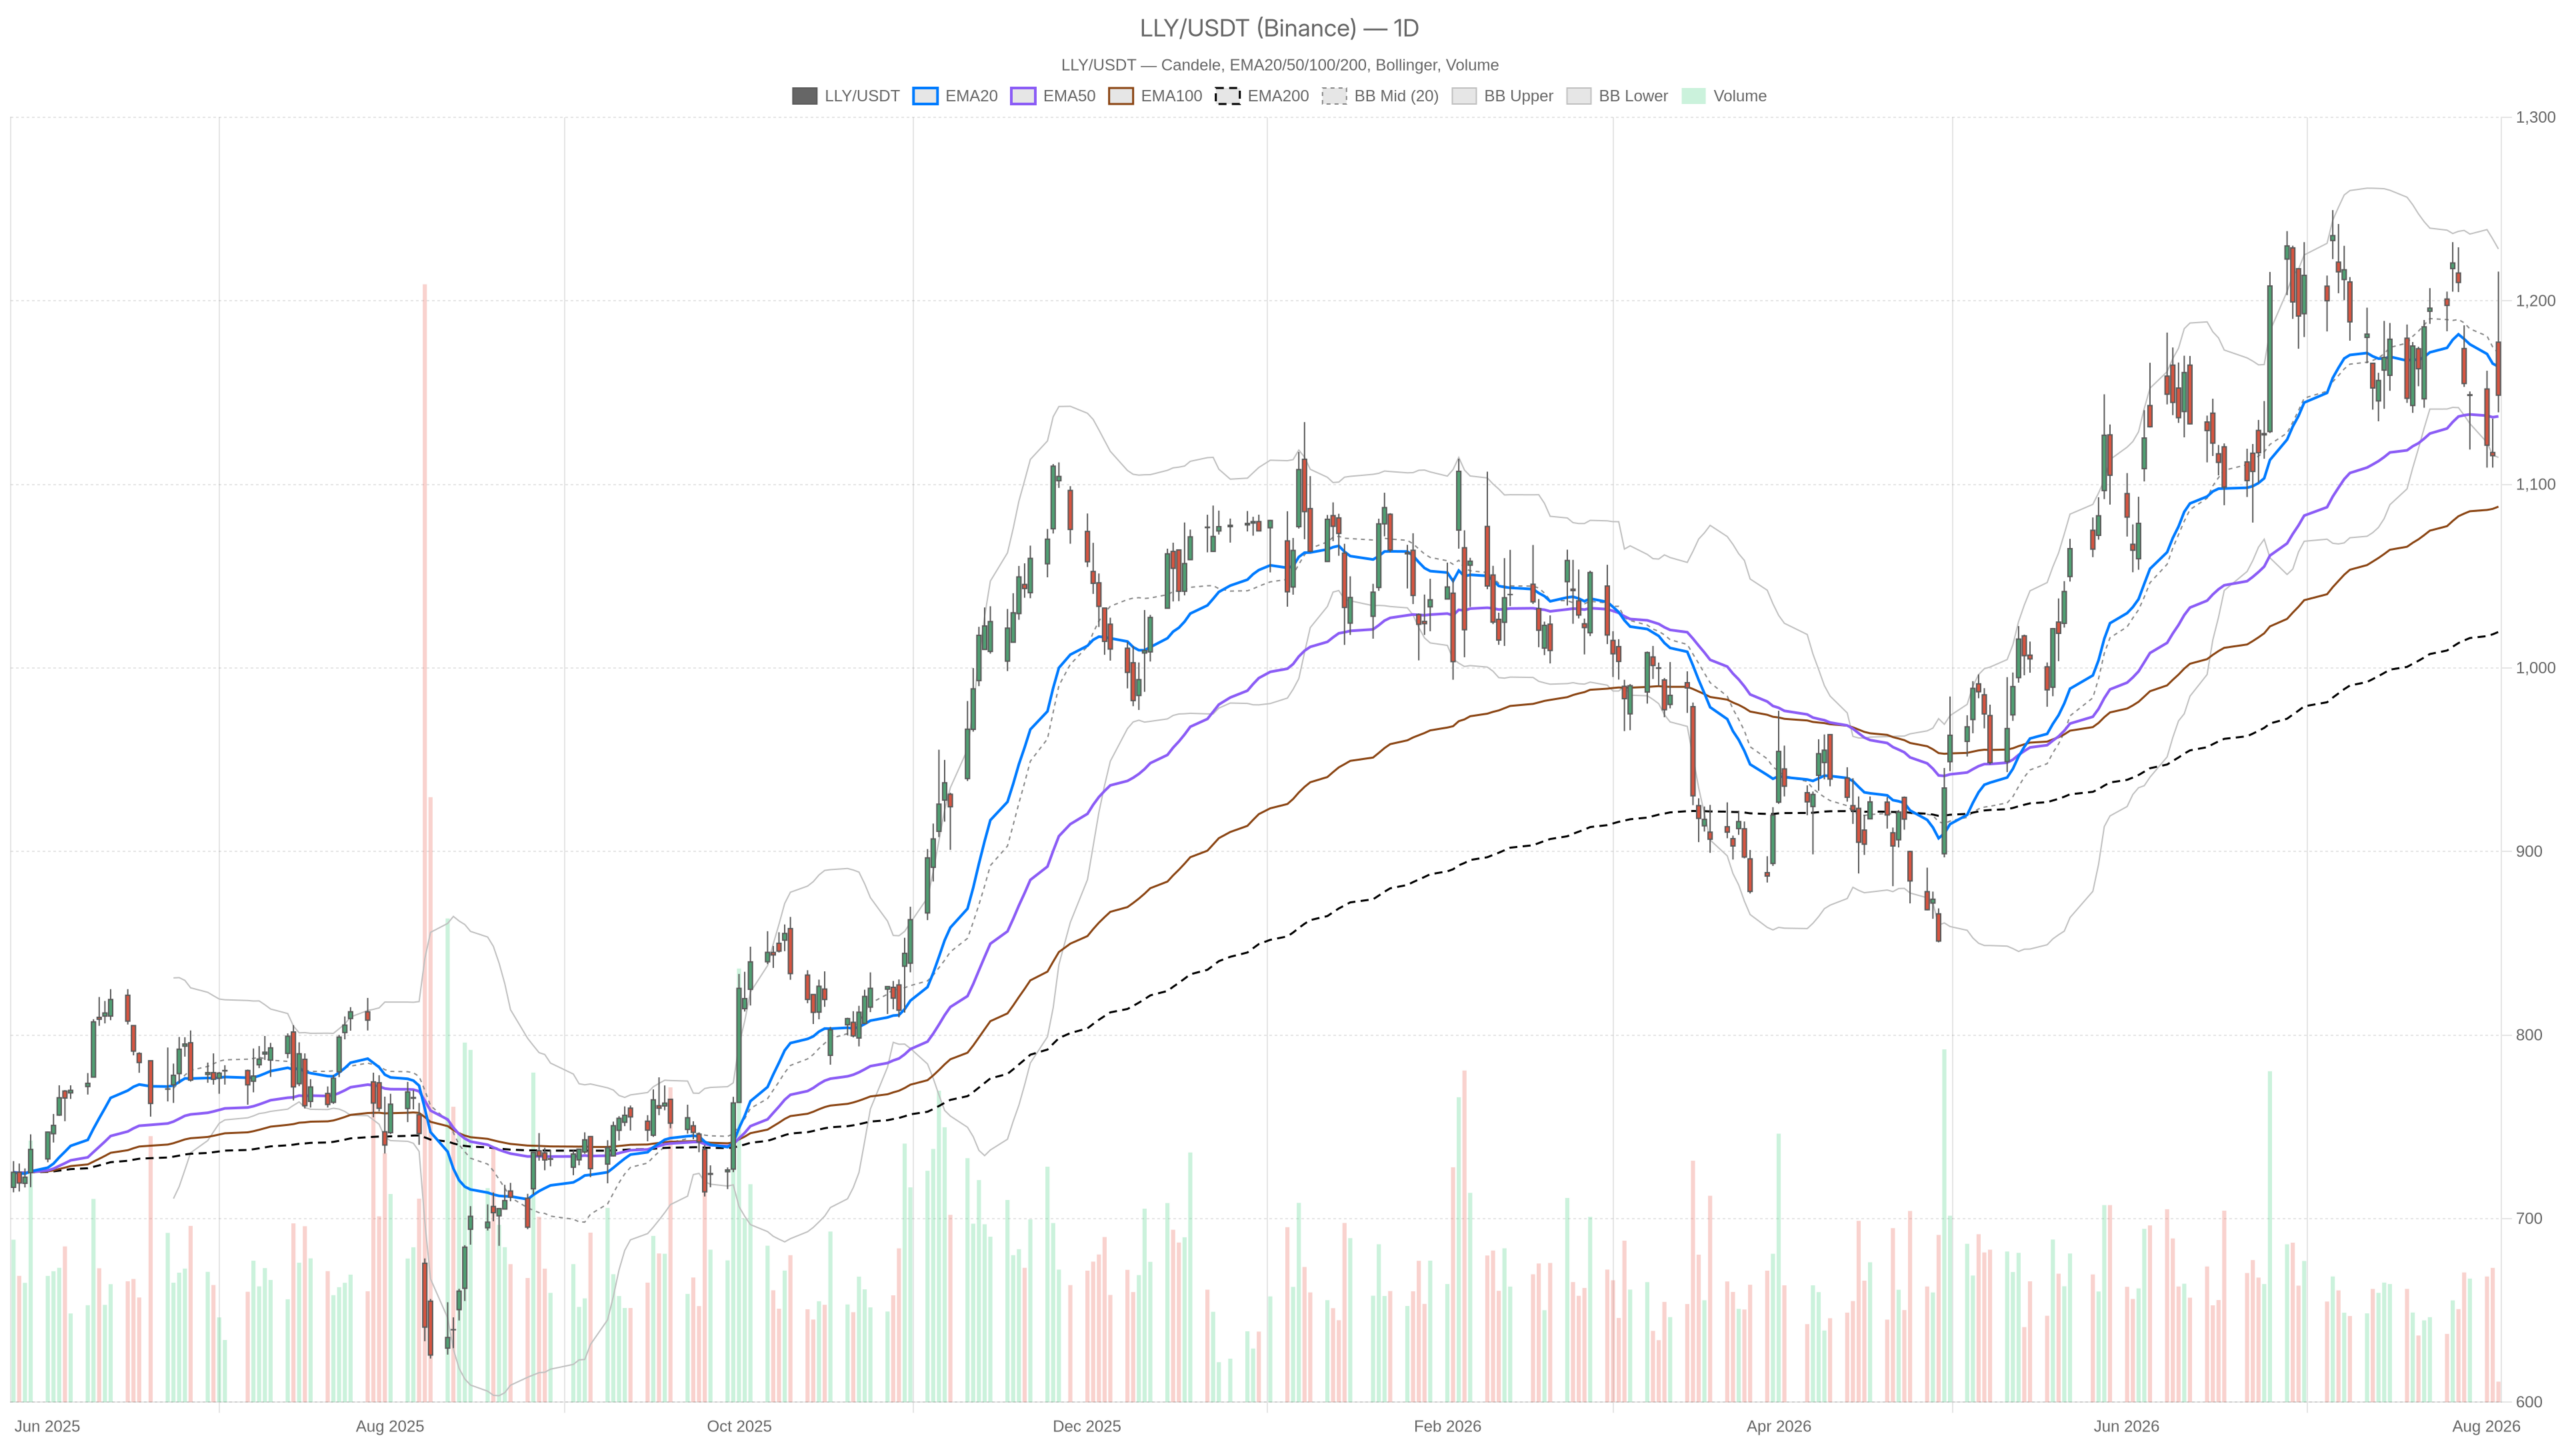
Eli Lilly and Company stock presents a sharp contrast: a strong Q2 earnings beat and raised 2026 guidance on one side, and a daily chart showing the stock giving back most gains on the other. Understanding why these two pictures disagree is key to reading LLY right now.
Key takeaways
- Eli Lilly reported better-than-expected Q2 2026 results, driven by injectable GLP-1 products and the oral pill Foundayo.
- Management raised full-year sales guidance, with the company now treating nearly 10% of the US obesity population with GLP-1 therapies.
- LLY opened at 1177.50, spiked to 1215.94, then reversed to close at 1148.61, forming a classic rejection candle on the daily chart.
- The…