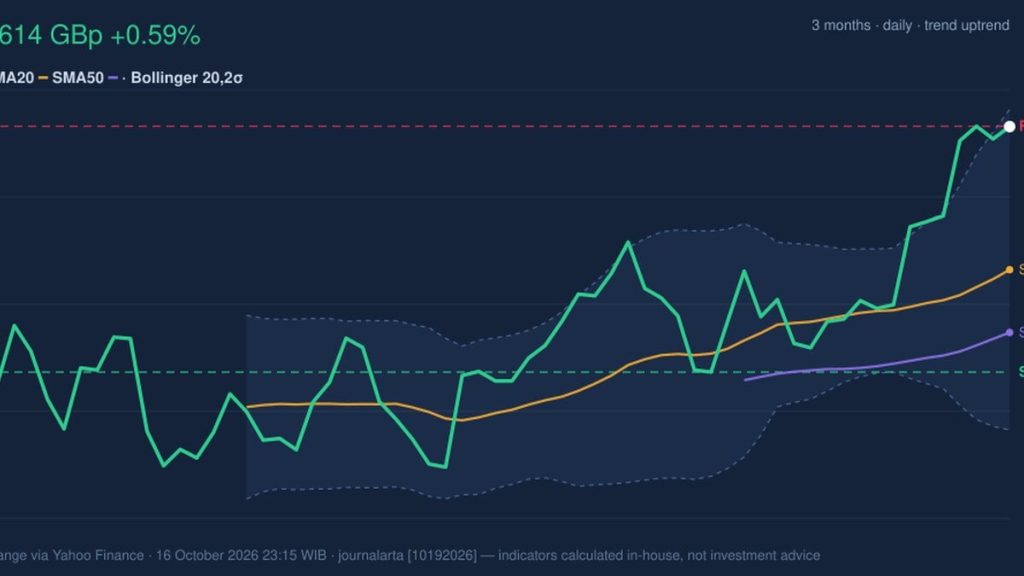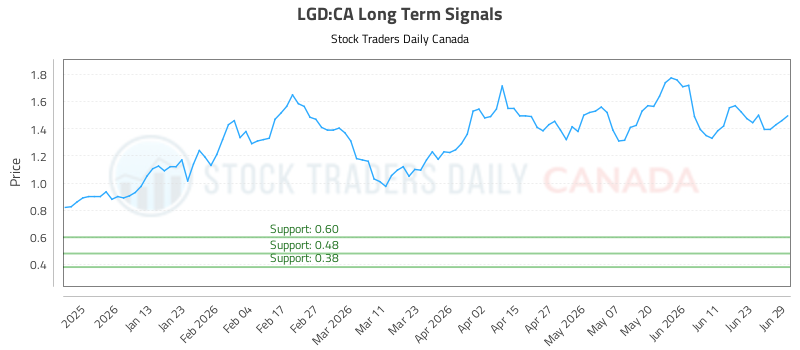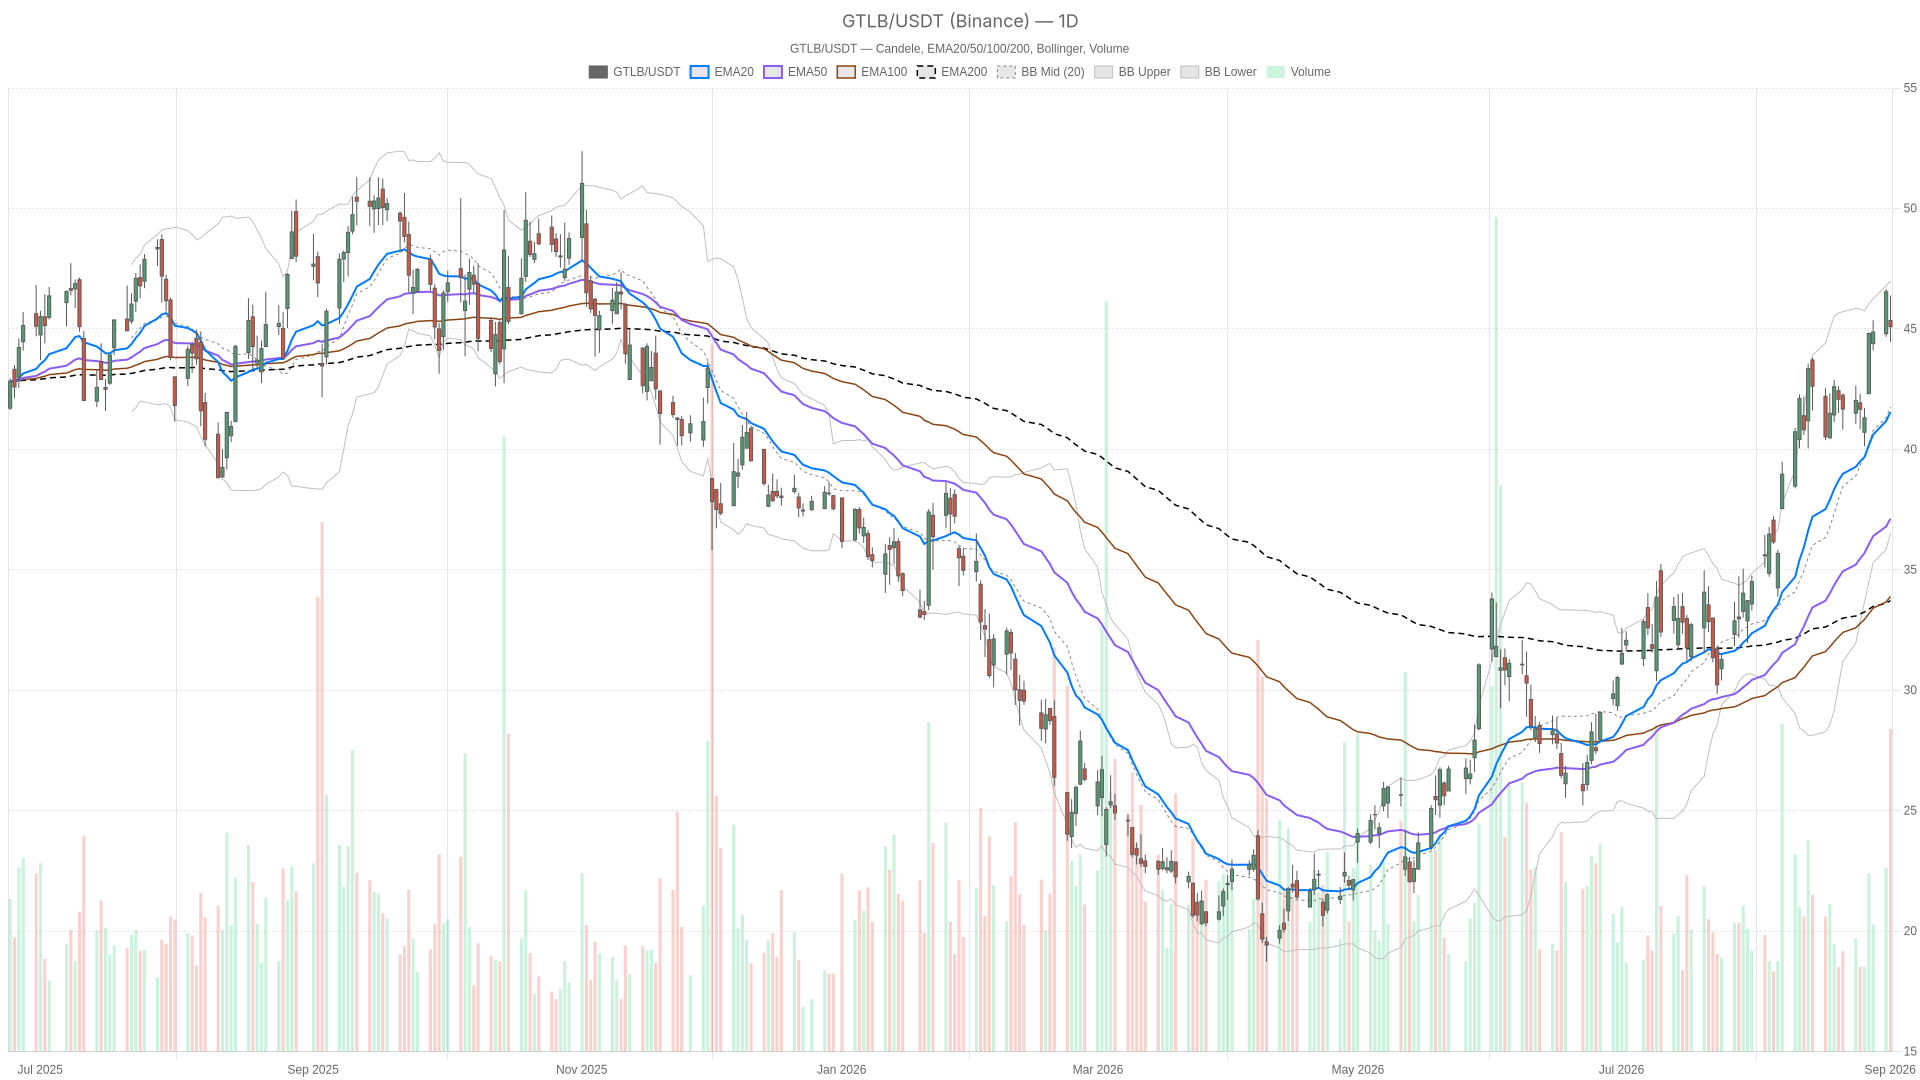
GitLab Inc. stock nears a fresh 52-week high following a strong Q2 report that beat expectations. The daily chart shows sustained strength. The shorter-term picture, however, is starting to show fatigue. That divergence between timeframes demands a closer look before deciding if this rally has legs.
Key takeaways
- GTLB’s daily trend remains bullish, with the 20, 50 and 200-period EMAs stacked in perfect alignment beneath price.
- The 1H MACD shows a bearish crossover with a negative histogram of -0.21, signaling cooling short-term momentum.
- GitLab reported Q2 FY2027 revenue of $286.3 million, up 21% year-over-year, and raised full-year guidance to between $1.129 billion…