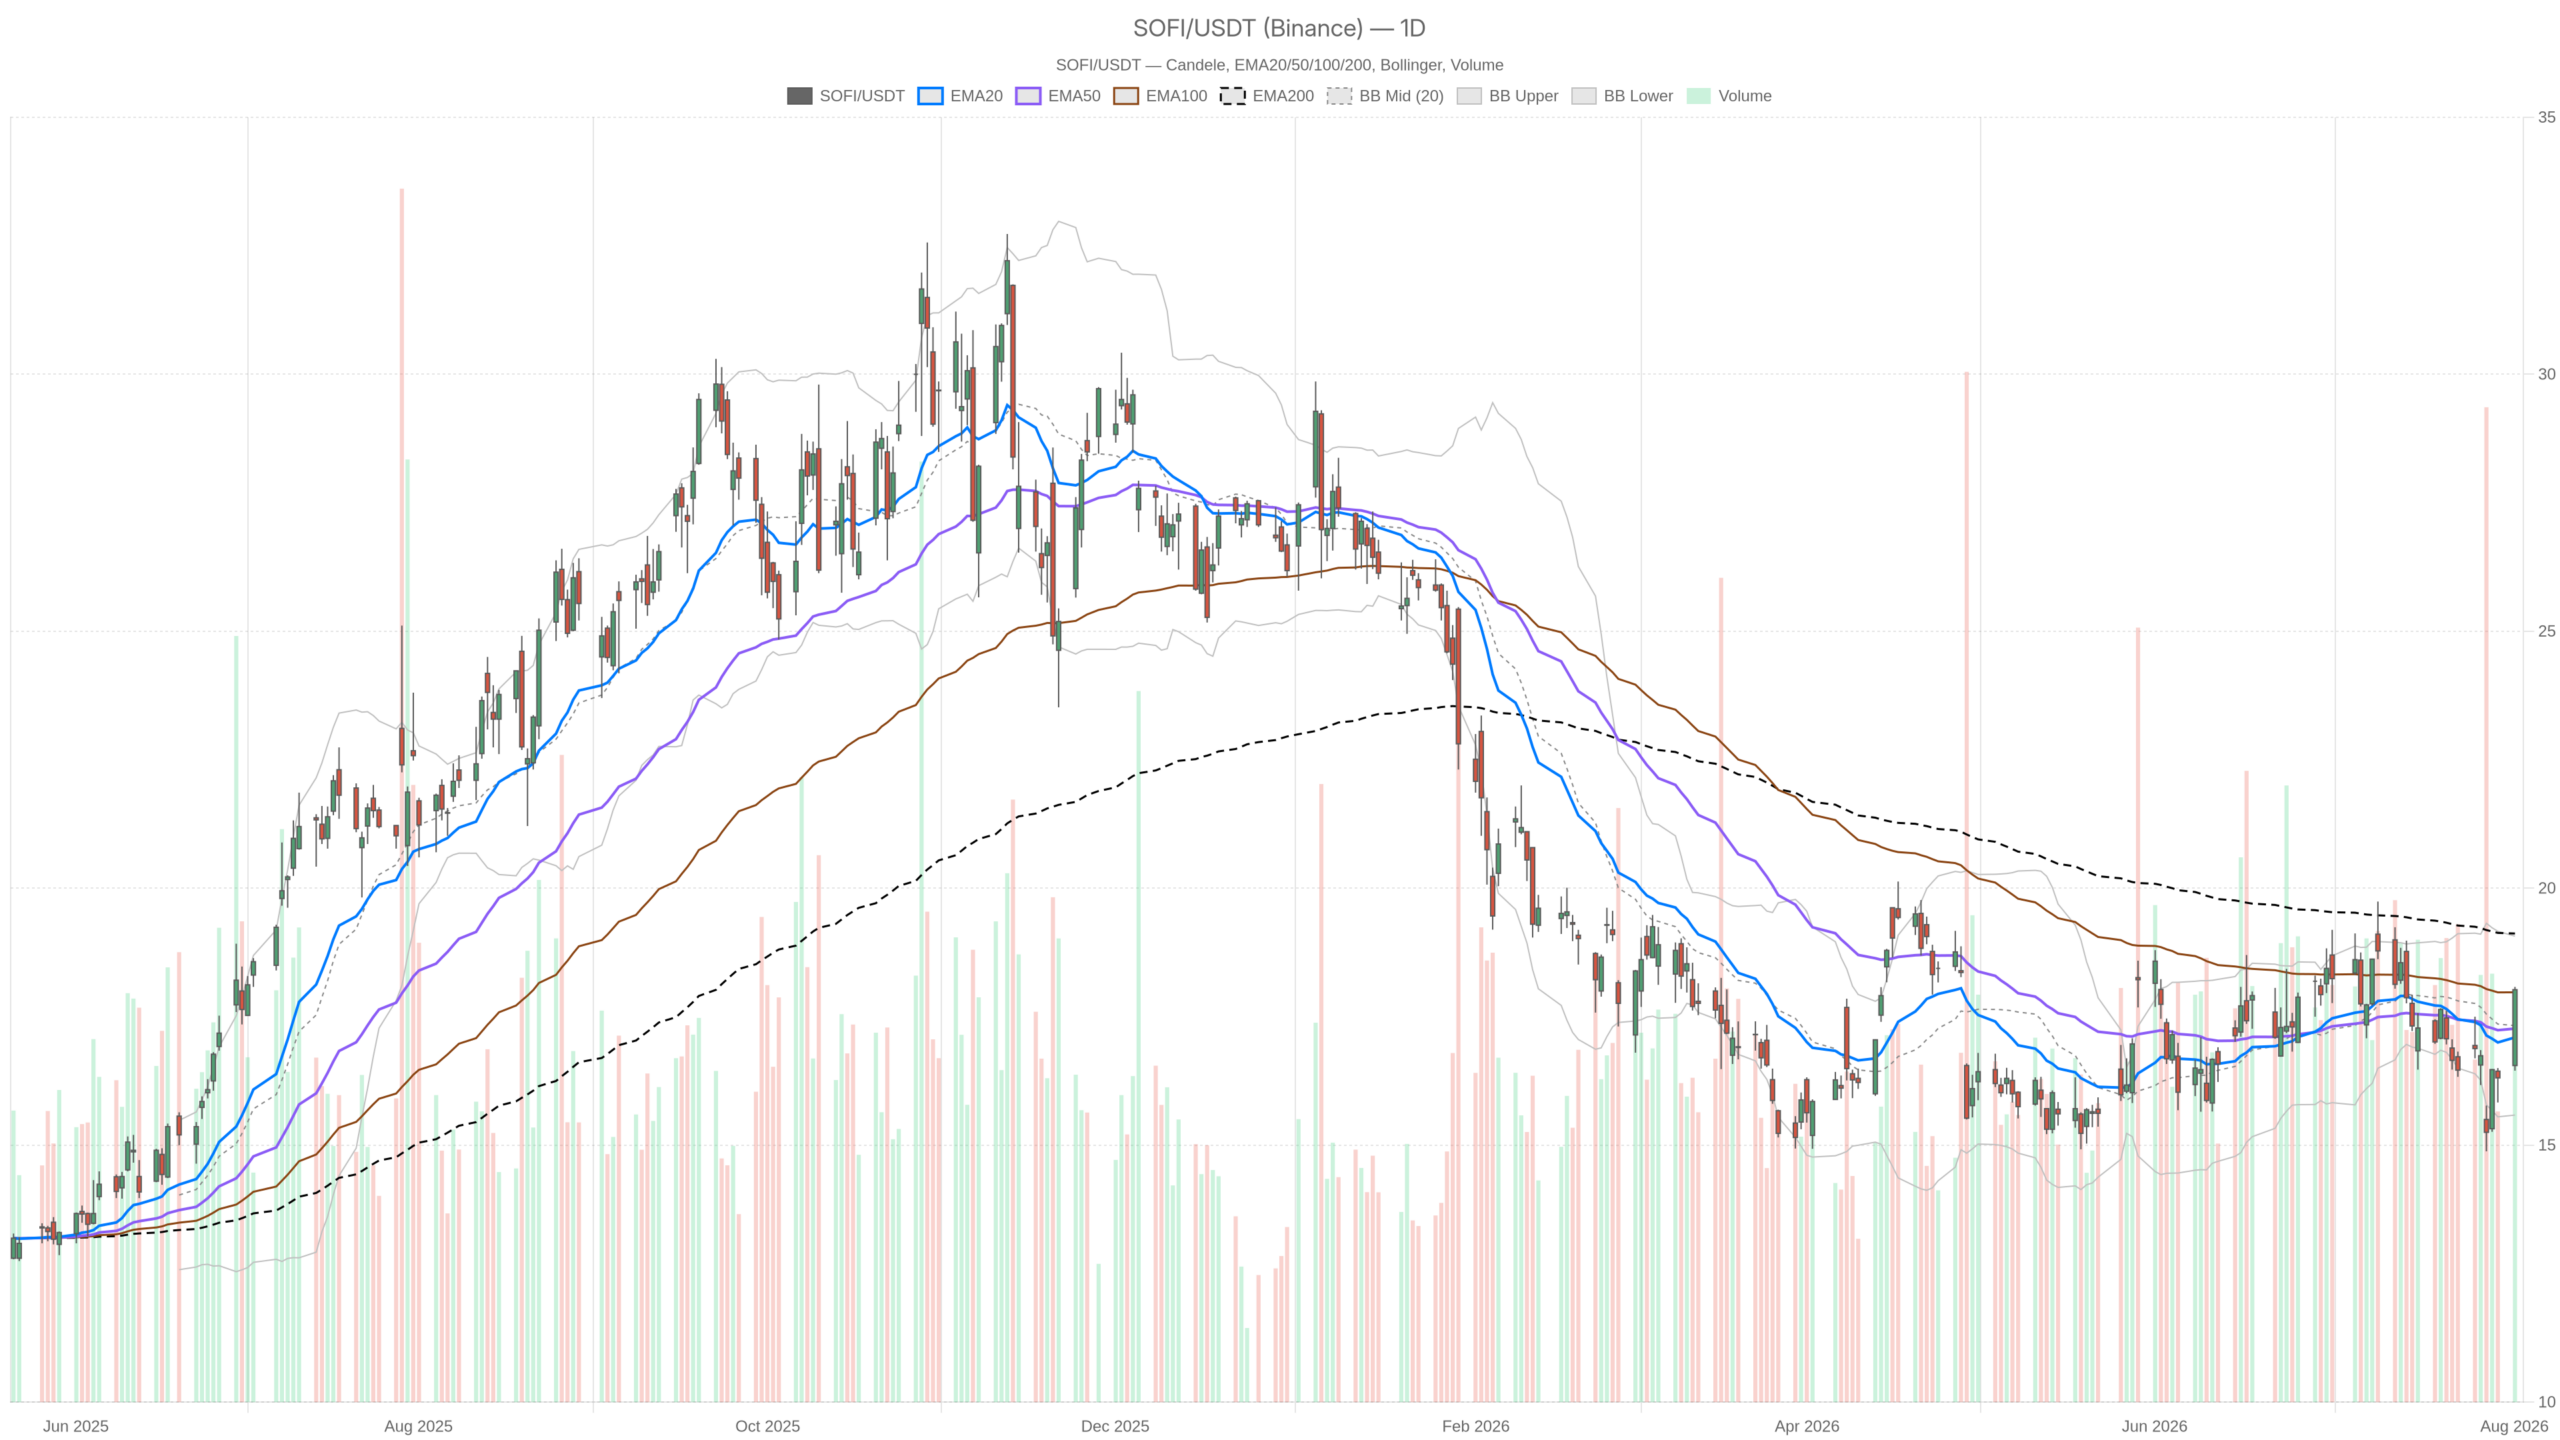
SoFi Technologies, Inc. stock surged post-earnings, closing at $18.02 on August 3. The session spanned a wide $16.45–$18.08 range on 75.7 million shares. This volatile action signals an active battle for control following the second-quarter report, with the stock now testing key resistance.
Key takeaways
- SoFi delivered 40.5% year-over-year revenue growth to $1.21 billion, with non-GAAP EPS of $0.12 beating consensus by 9.9%
- The daily trend remains neutral despite the rebound, with RSI at 55.57 and MACD still technically negative
- Hourly RSI has reached overbought territory at 74, creating a clear timeframe divergence against the still-neutral daily chart
- The critical…