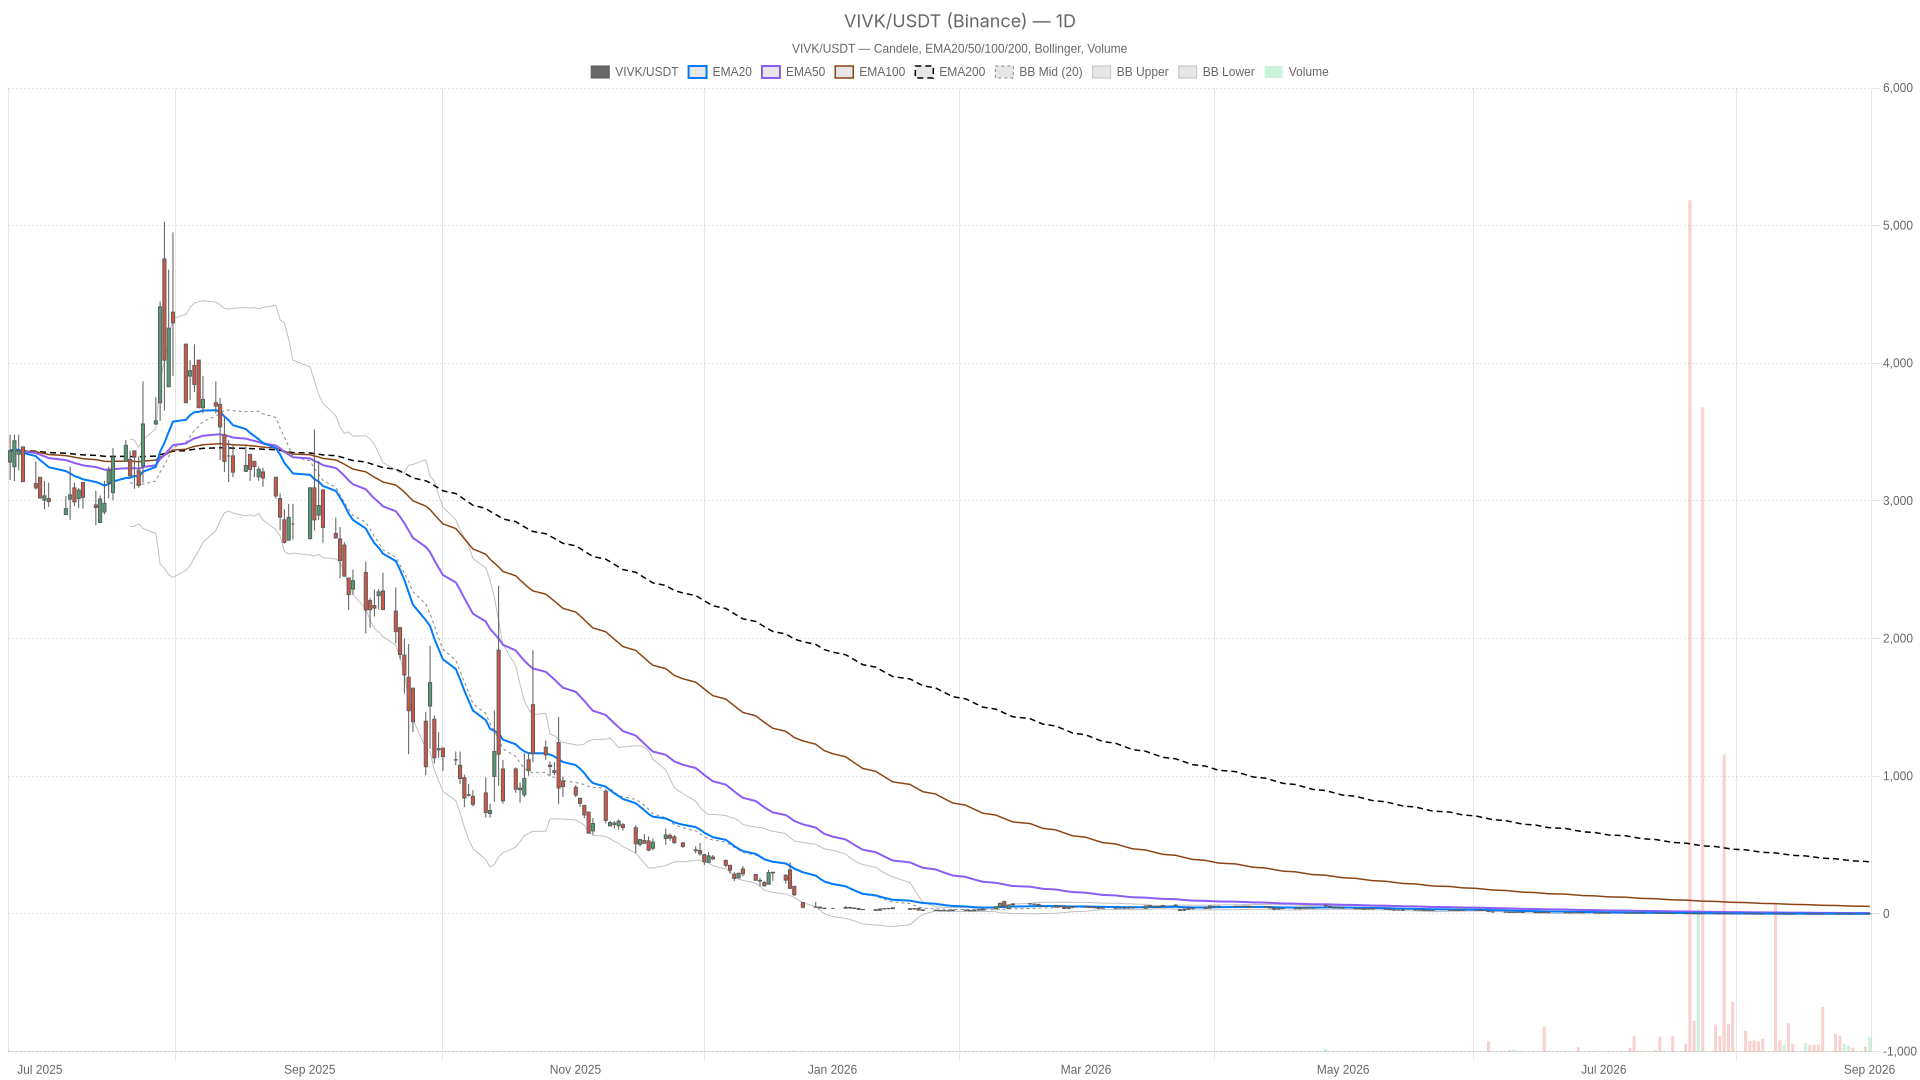
Vivakor, Inc. stock closed at $0.78 on September 1, but the daily chart remains trapped in a deep structural downtrend. Shorter-term charts hint at tentative stabilization. The tension between these timeframes defines the entire setup.
Key takeaways
- Vivakor, Inc. stock settled at $0.78 with a daily RSI14 of 25.8, deep in oversold territory.
- The daily EMA stack — 20-day at $1.37, 50-day at $6.13, 200-day at $377.72 — confirms a firmly bearish structure.
- The MACD histogram turned positive at 0.23, signaling decelerating downside momentum.
- Shorter-term charts show neutral-to-mildly-bullish conditions, but the 1-hour and daily bearish regimes remain…