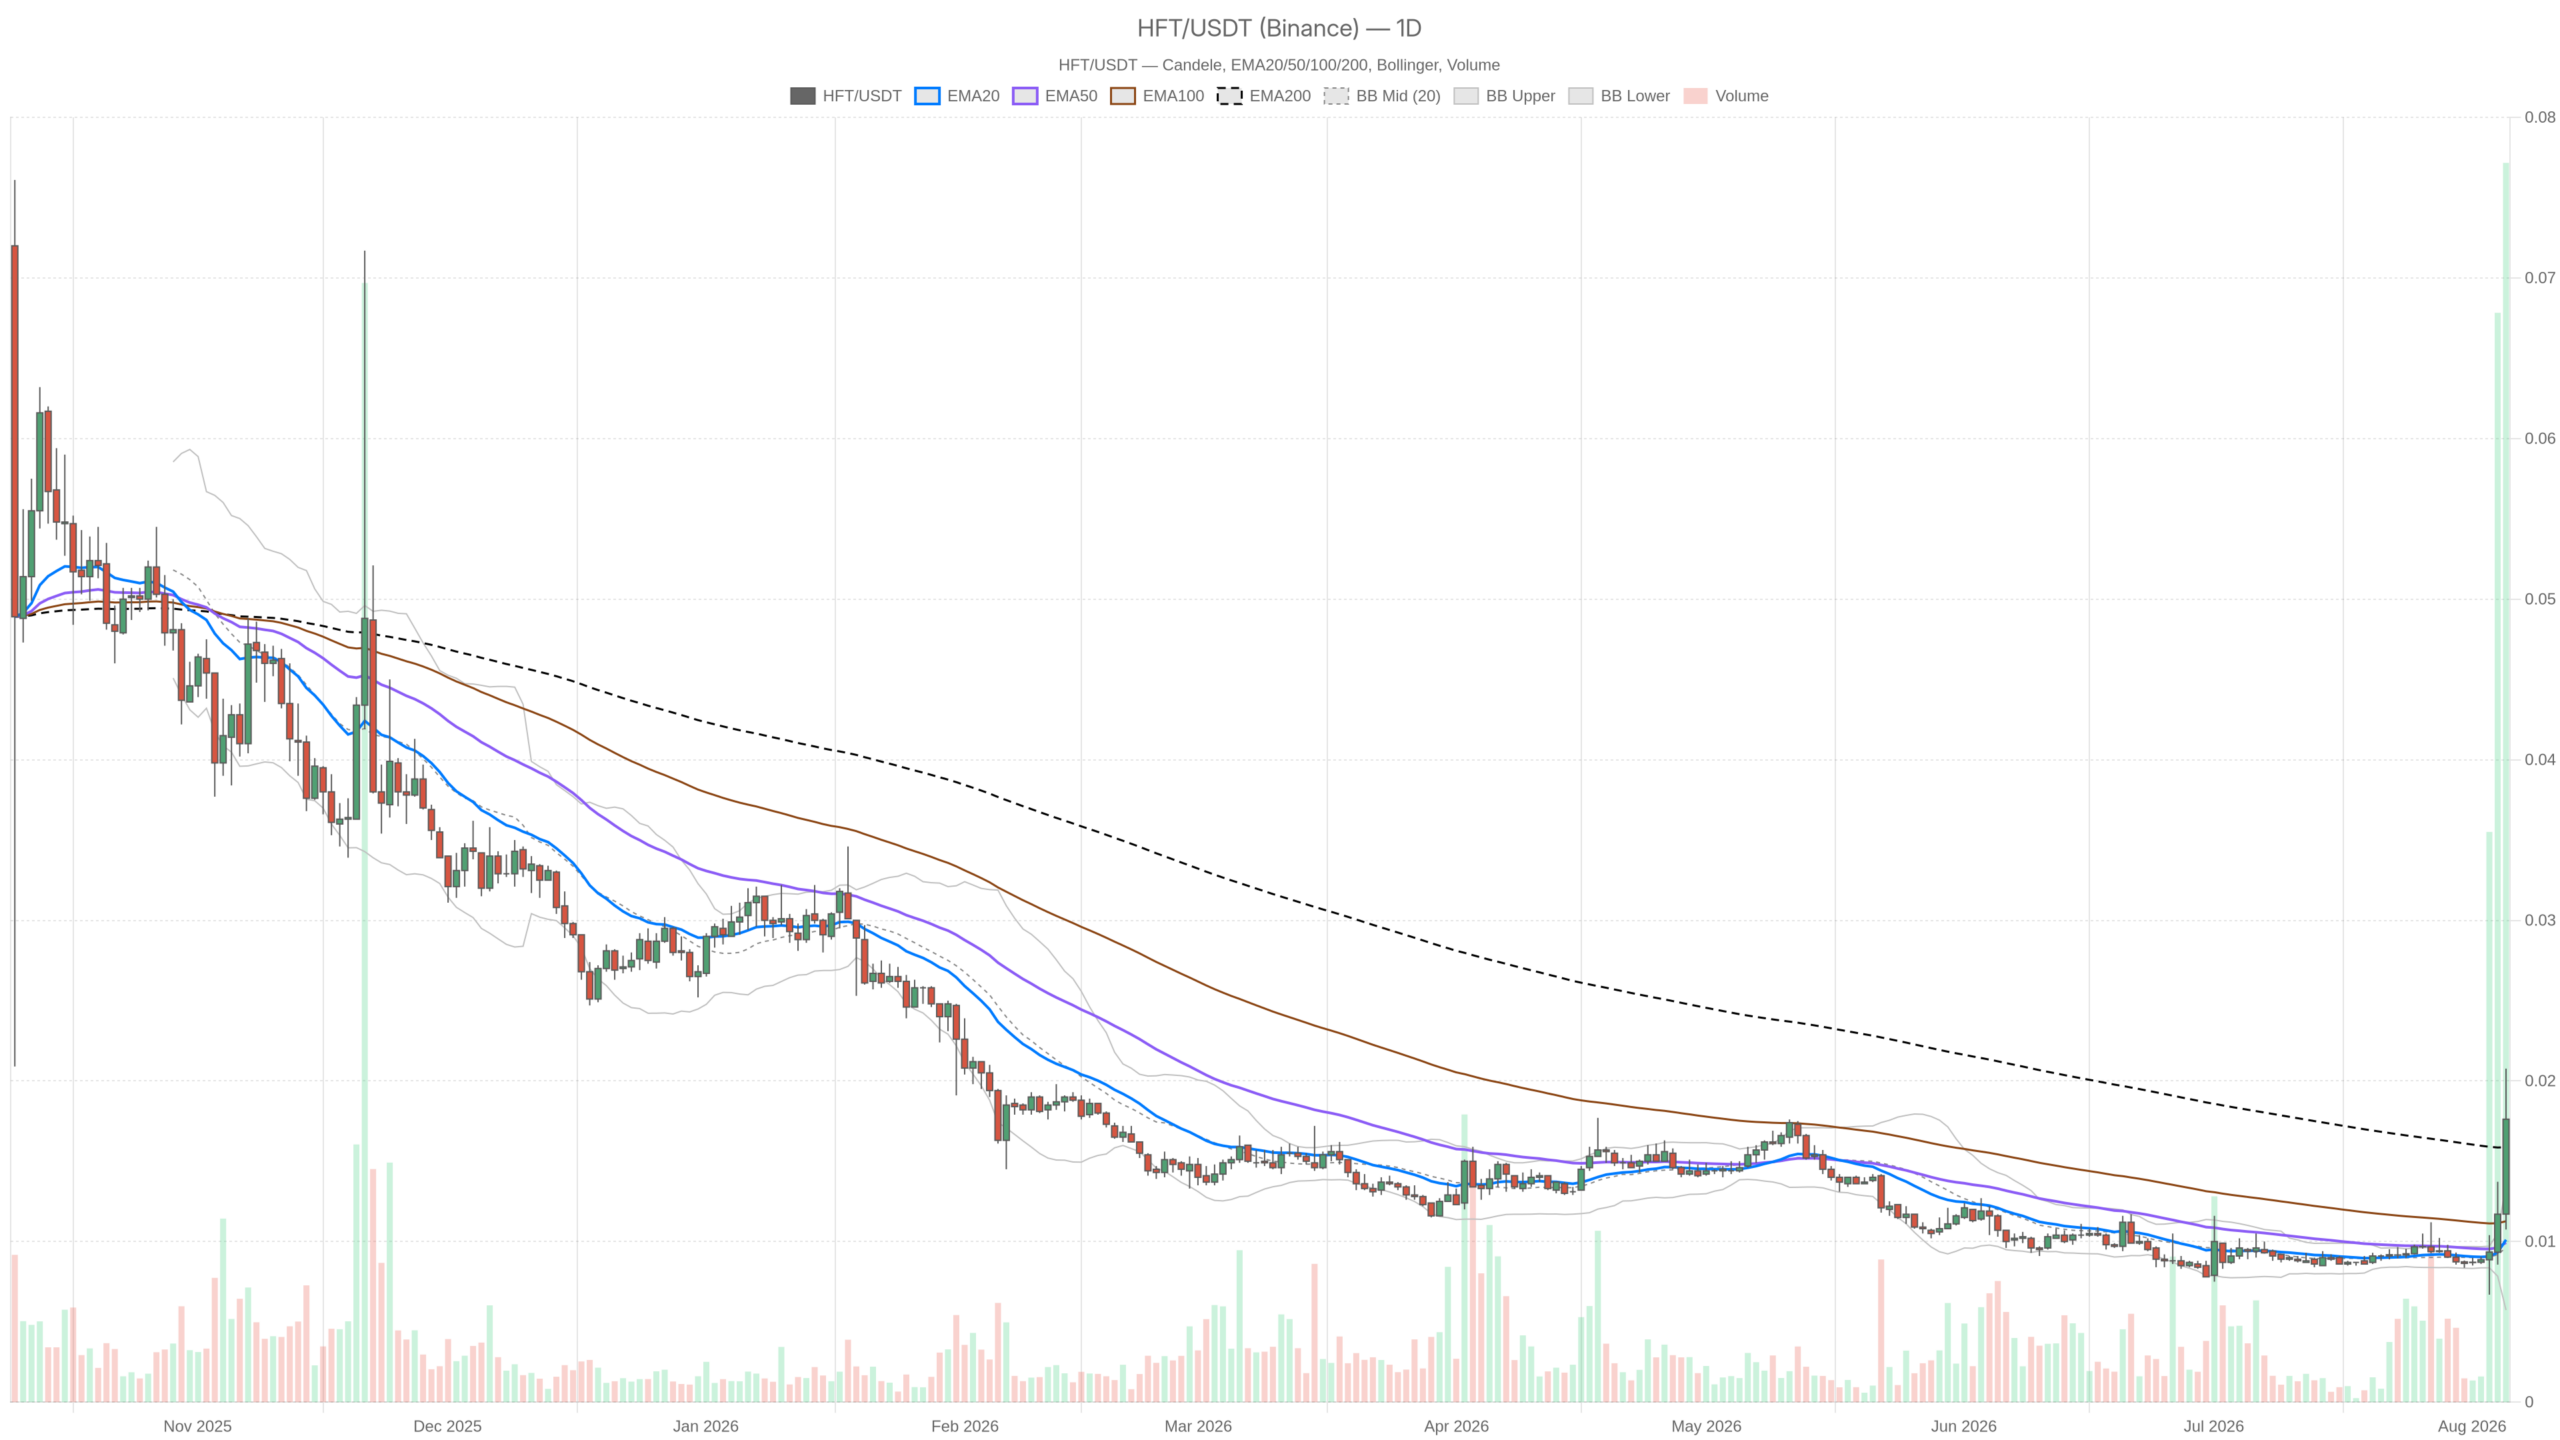
As of August 5, 2026, traders watching Hashflow crypto (HFT) face conflicting signals. The daily RSI has rocketed to 87.91 — normally screaming exhaustion — yet shorter-term charts remain structurally intact. That gap between a stretched daily oscillator and a calmer intraday tape is the tension to watch.
Key takeaways
- HFT’s daily RSI has spiked to 87.91, historically signaling exhaustion risk on the highest timeframe.
- The 1-hour chart maintains a bullish EMA alignment, with price above the 20, 50, and 200-period averages.
- The broader Fear & Greed Index sits at 27, reflecting persistent caution across the crypto market.
- DEX sector data shows mixed fee trends,…