NextEra Energy Inc (NEE) stocks Elliott Wave technical analysis [Video]
NEE Elliott Wave Analysis Trading Lounge.
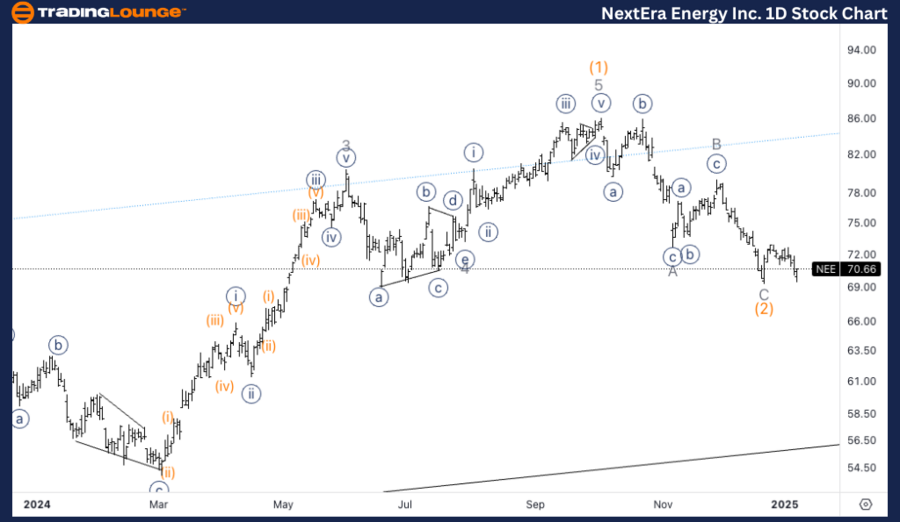
NextEra Energy Inc., (NEE) Daily Chart.
NEE Elliott Wave technical analysis
Function: Counter Trend.
Mode: Corrective.
Structure: Flat.
Position: Wave C of (2).
Direction: Bottom in wave C.
Details: Looking for a potential bottom in wave (2) as we have reached the area of the previous 4 which is often times a target for wave C of the same degree.
NextEra Energy Inc., (NEE) 1H Chart.
NEE Elliott Wave technical analysis
Function: Counter Trend.
Mode: Corrective.
Structure: Flat.
Position: Wave C of (2).
Direction: Bottom in wave C.
Details: Here we are looking at a potential wave {i} and {ii} in place knowing we are very close to invalidation level,…


