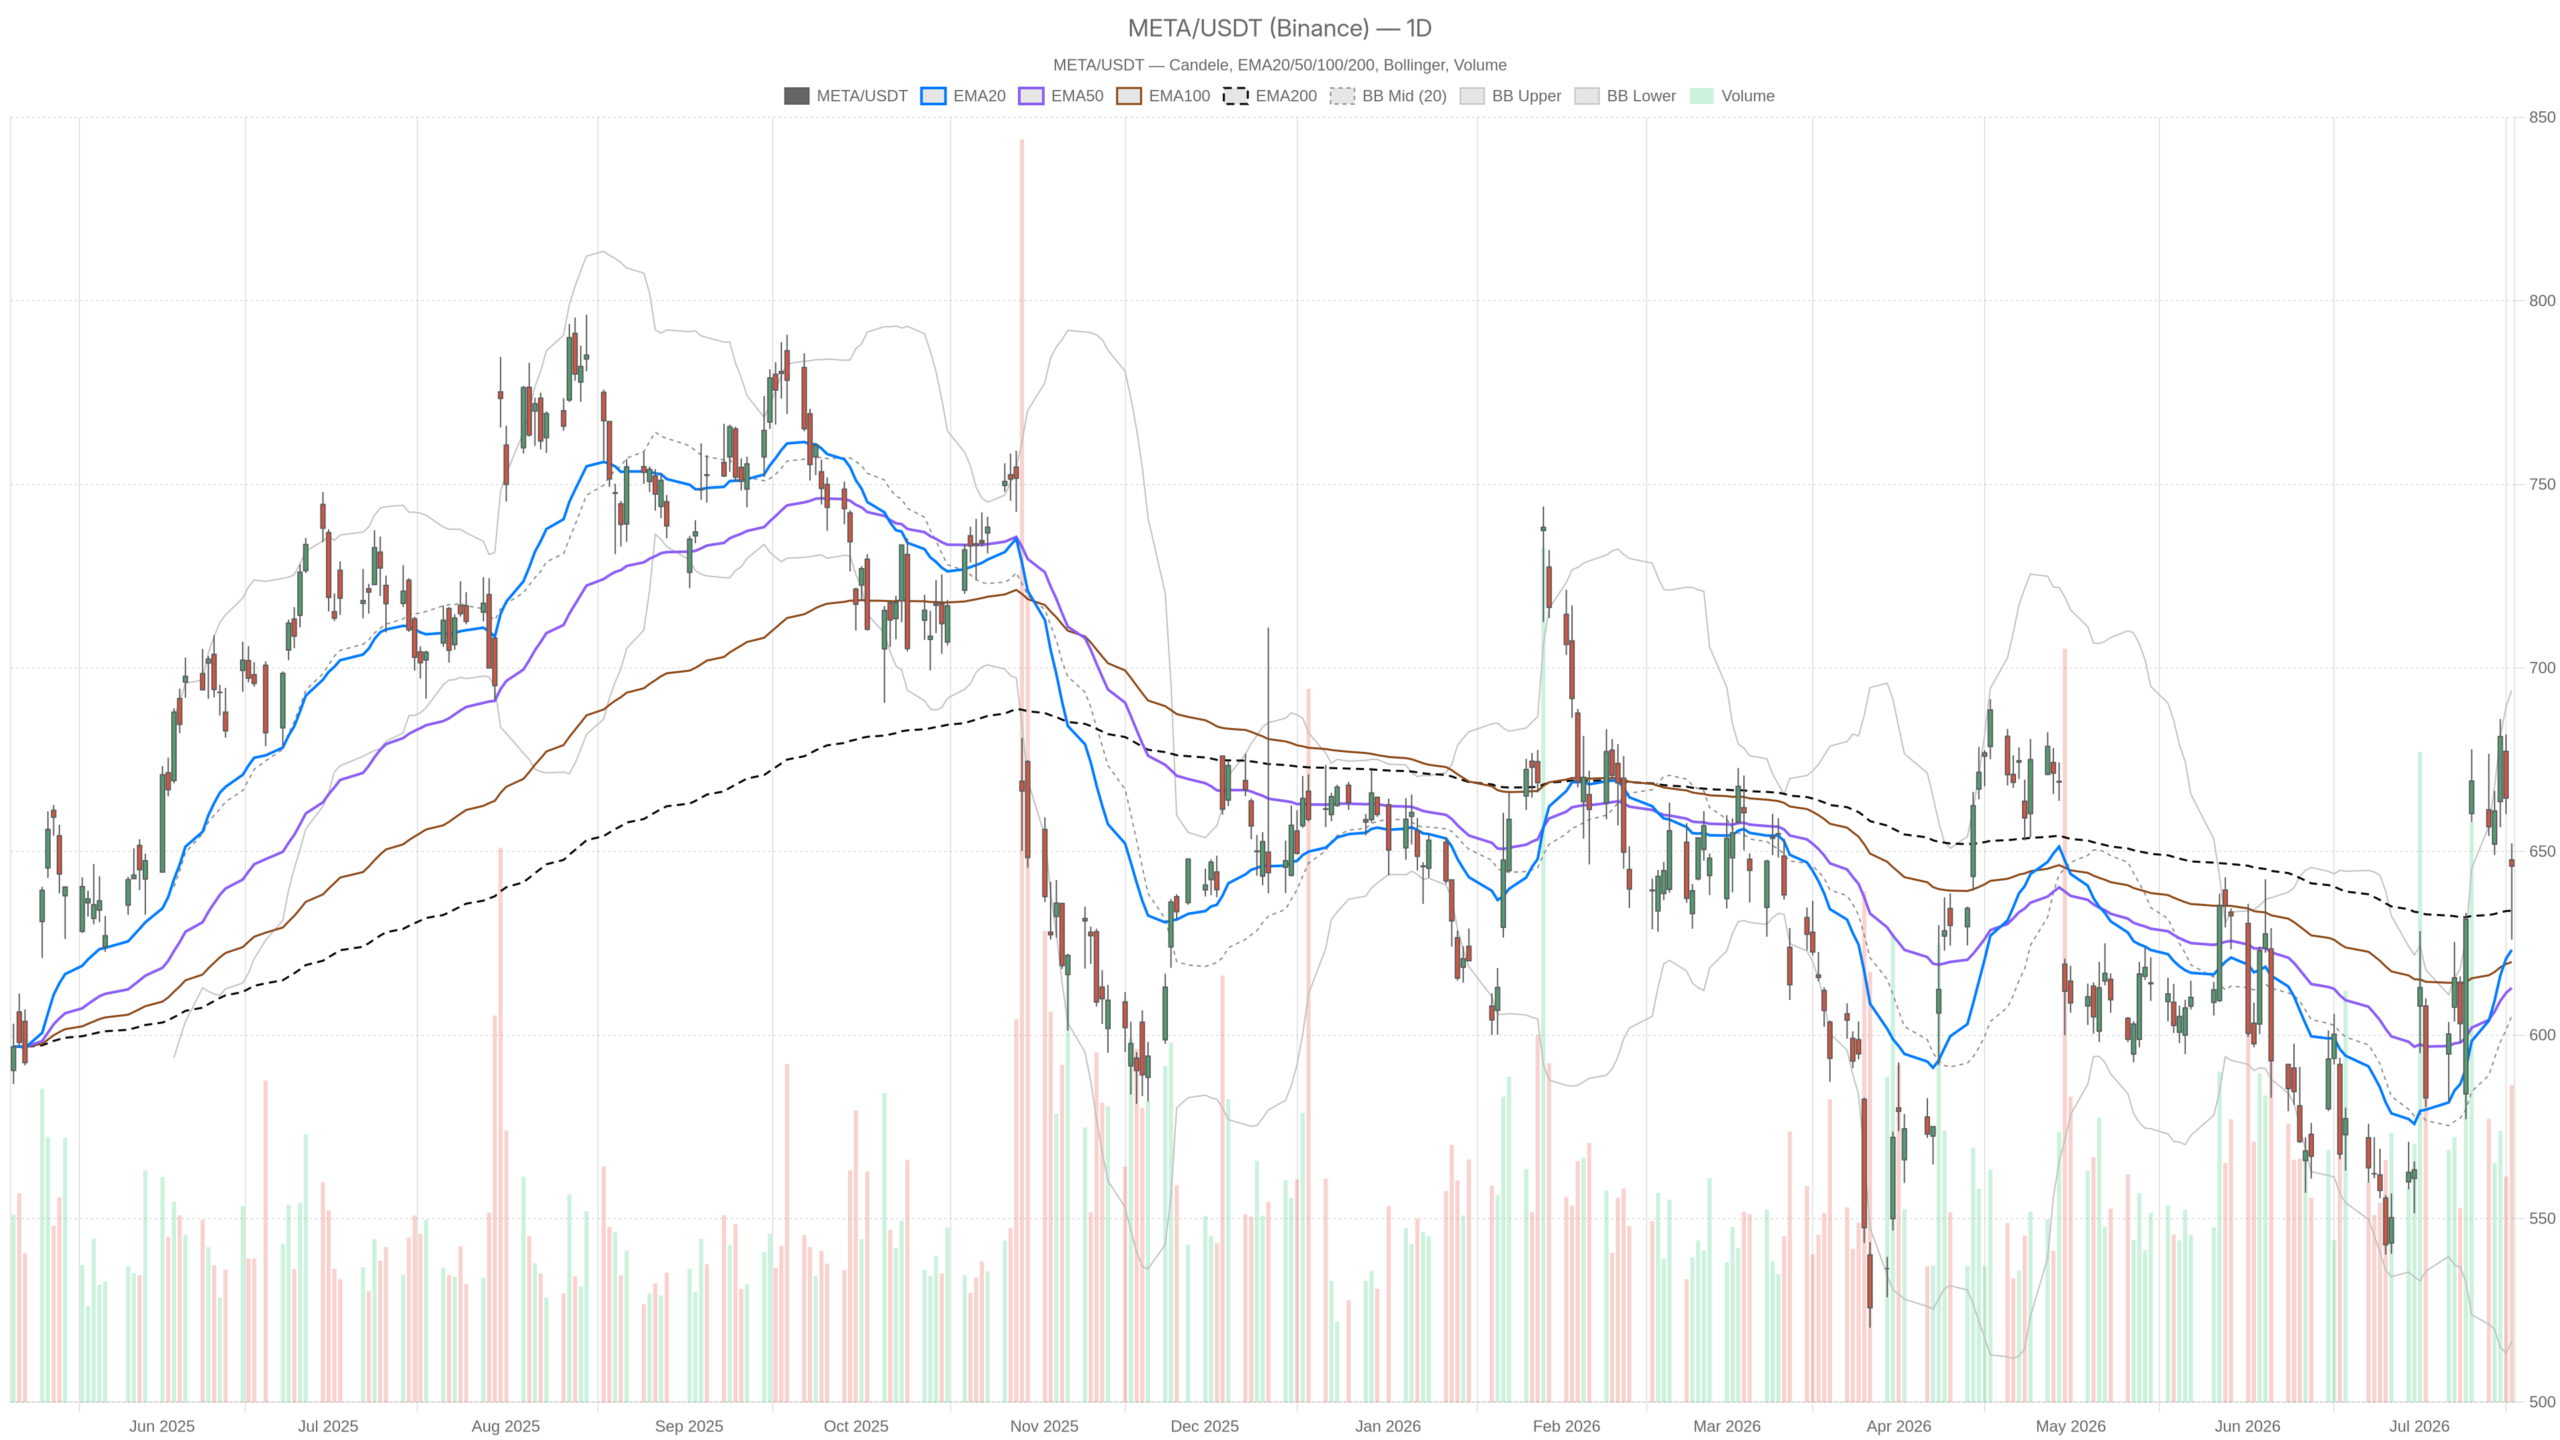
Meta stock trades at $646.01, caught between a strong daily uptrend and mounting intraday selling pressure. July’s 21% surge added $270 billion in market cap. Yet the latest session’s 3.1% drop raises a pressing question: can the rally survive this pullback?
Key takeaways
- Meta stock closed at $646.01 on July 17, up 21% in July, adding $270 billion in market capitalization.
- The daily trend remains bullish with price above the EMA20 ($623.20), EMA50 ($612.83), and EMA200 ($633.89).
- The 1-hour chart shows bearish pressure with price below both the EMA20 ($655.36) and EMA50 ($649.00).
- The session’s 3.1% intraday decline was tied to AI spending concerns and broader…