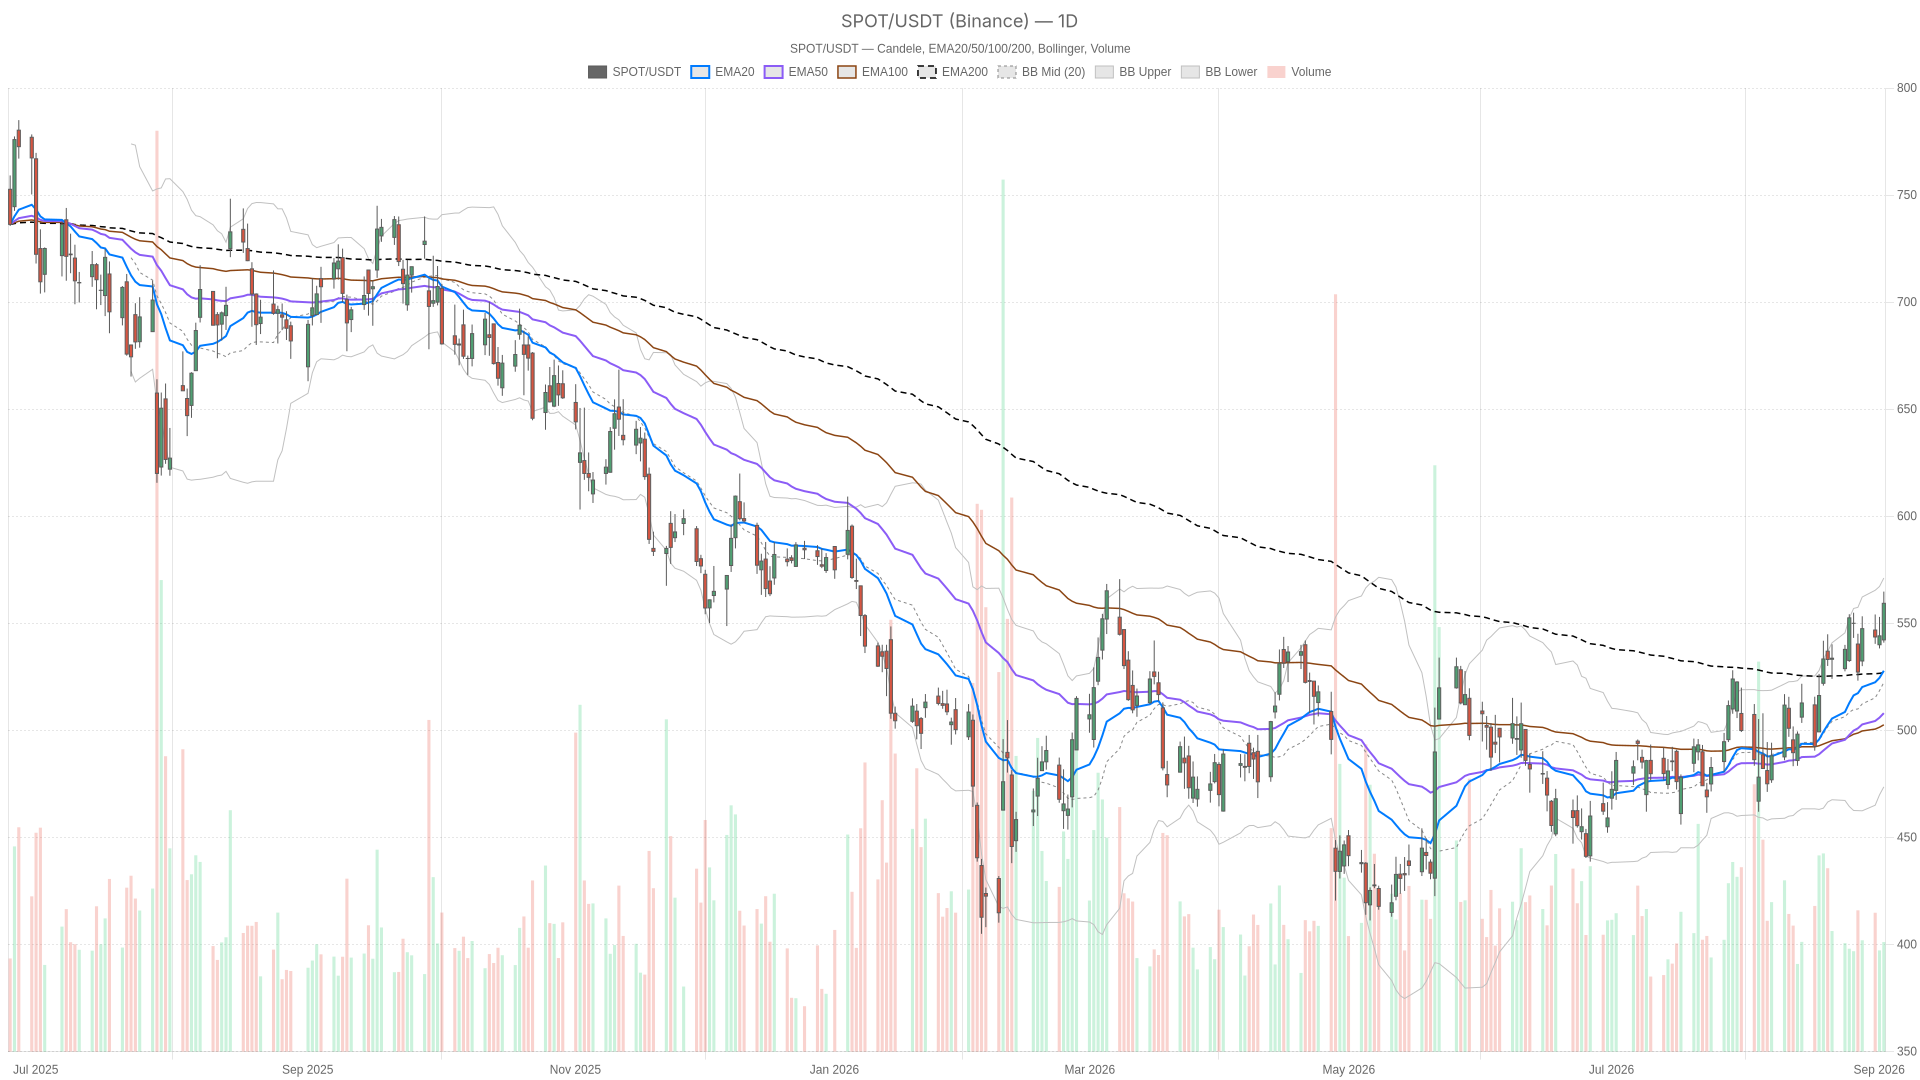
Spotify stock closed at $559.36 on the daily chart, near the top of its recent range. Price sits above all three major moving averages with positive momentum. However, shorter-term charts suggest the rally is now pausing rather than accelerating.

Key takeaways
- SPOT closed at $559.36, above EMA20 ($527.86), EMA50 ($508.05), and EMA200 ($526.98)
- Daily MACD histogram keeps expanding at 2.19, with the line at 15.6 above the signal at 13.42
- RSI14 at 63.59 leaves ample room before reaching overbought territory
- Key resistance sits at $569.13–$571.16, where daily R1 and the upper Bollinger Band converge
- A $1.5 billion buyback expansion and 14.6% streaming growth reinforce…