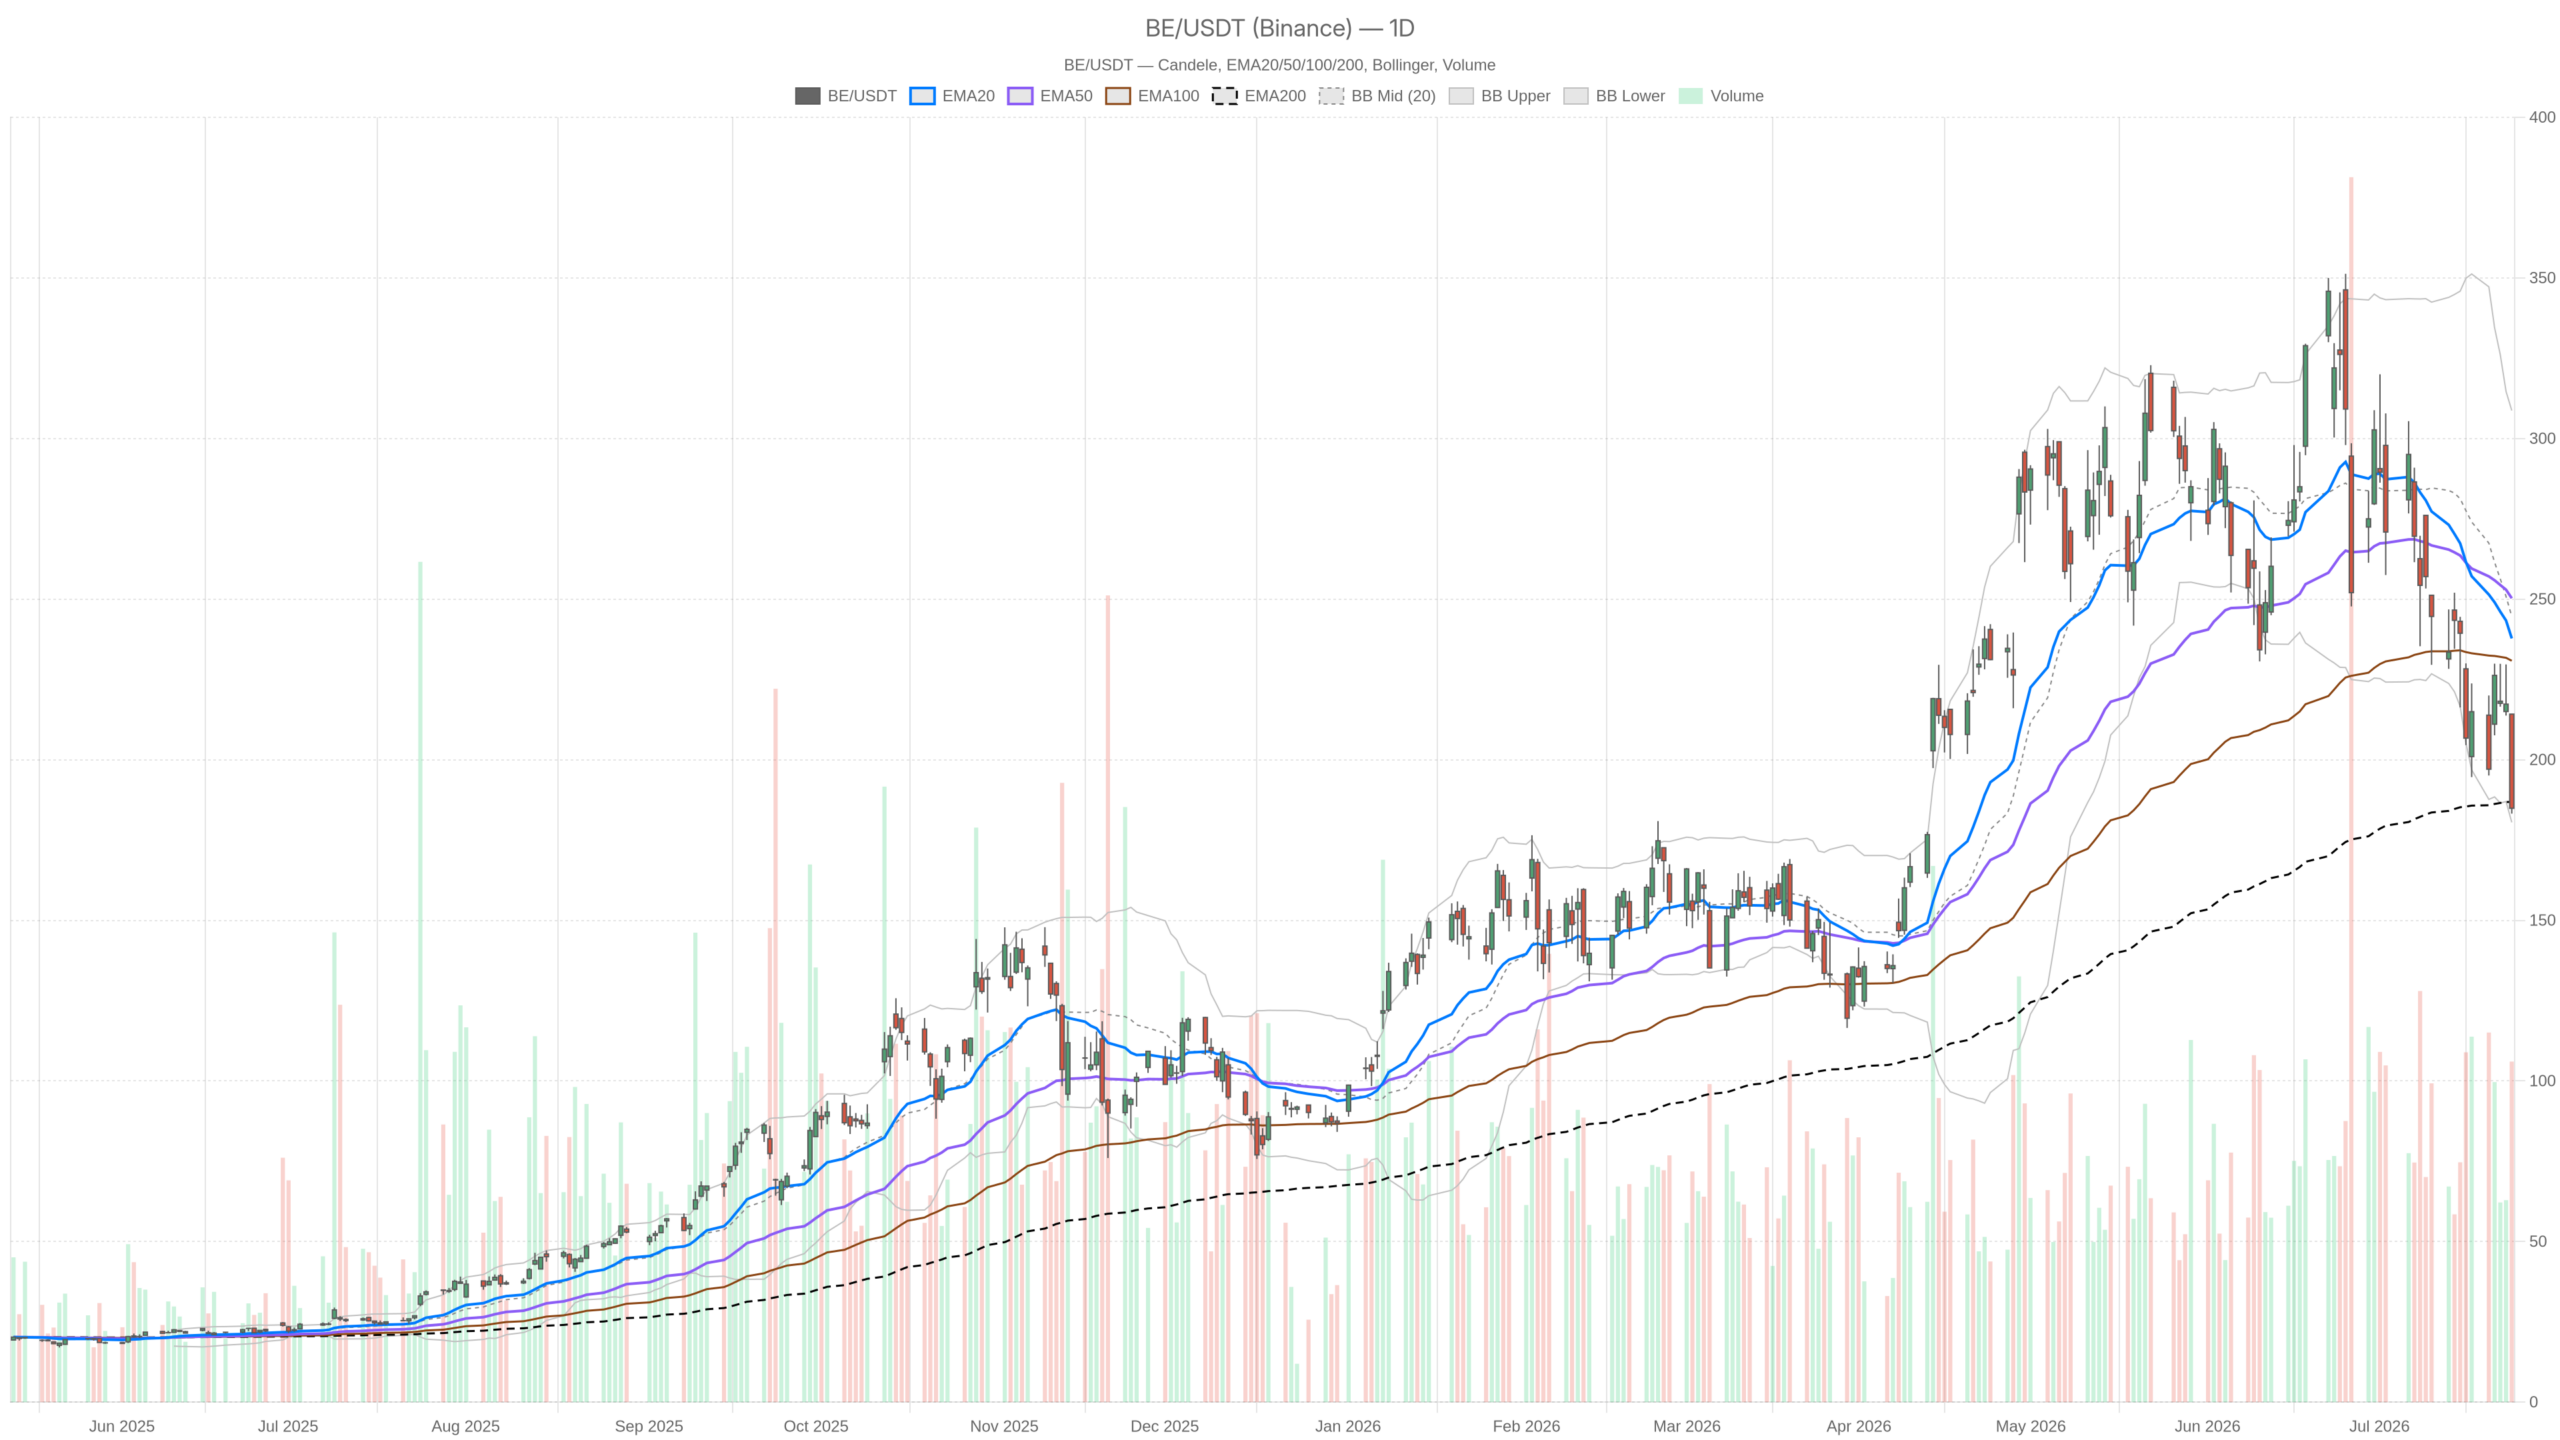
Bloom Energy stock sits at a critical inflection point. After shedding roughly 43% in a single month, BE closed at $184.89 on July 24. That places it just above the daily Bollinger lower bound. With Q2 earnings due July 28, genuine two-way risk dominates the setup.
Key takeaways
- BE has dropped roughly 43% in one month, closing at $184.89 on July 24.
- The daily EMA200 at $186.84 is the last structural support buffer on the daily chart.
- Daily RSI at 36.11 approaches oversold territory; 1H RSI at 27.53 signals deeply oversold conditions.
- Q2 earnings on July 28 create a binary catalyst, with a daily ATR of $26.32 signaling elevated volatility.
- A daily close below $186.84…