Bitcoin forms a bearish continuation pattern
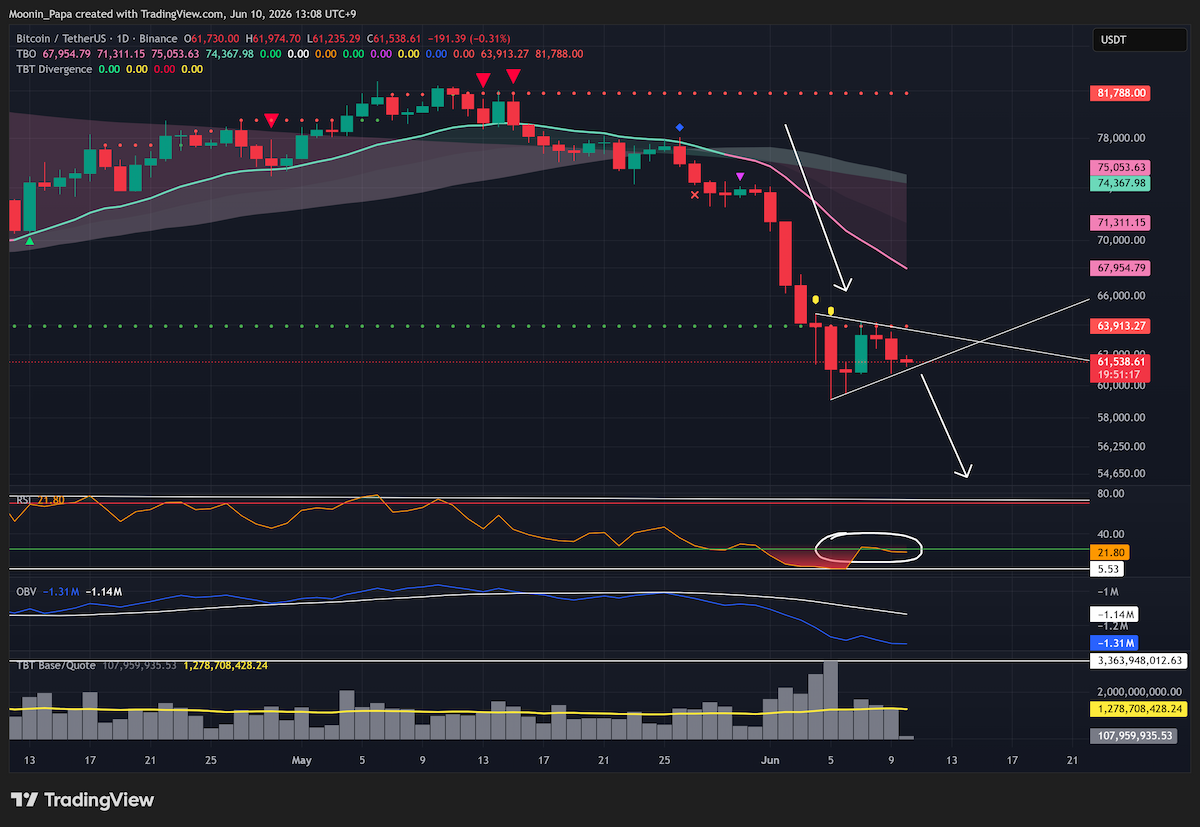
Bitcoin closed down just over 2% on Tuesday and has now formed a bearish pennant on the daily chart. The structure is defined by higher lows and lower highs, creating a triangular pause after the prior move. Because this is a continuation pattern, the key support area is now around $61,000.
If that support breaks, the next artificial support target remains $49,000. The bearish view is reinforced by daily RSI falling back below 25 into oversold territory, while both OBV and the TBO remain strongly bearish with no meaningful change in trend structure.
Ethereum breaks short-term support
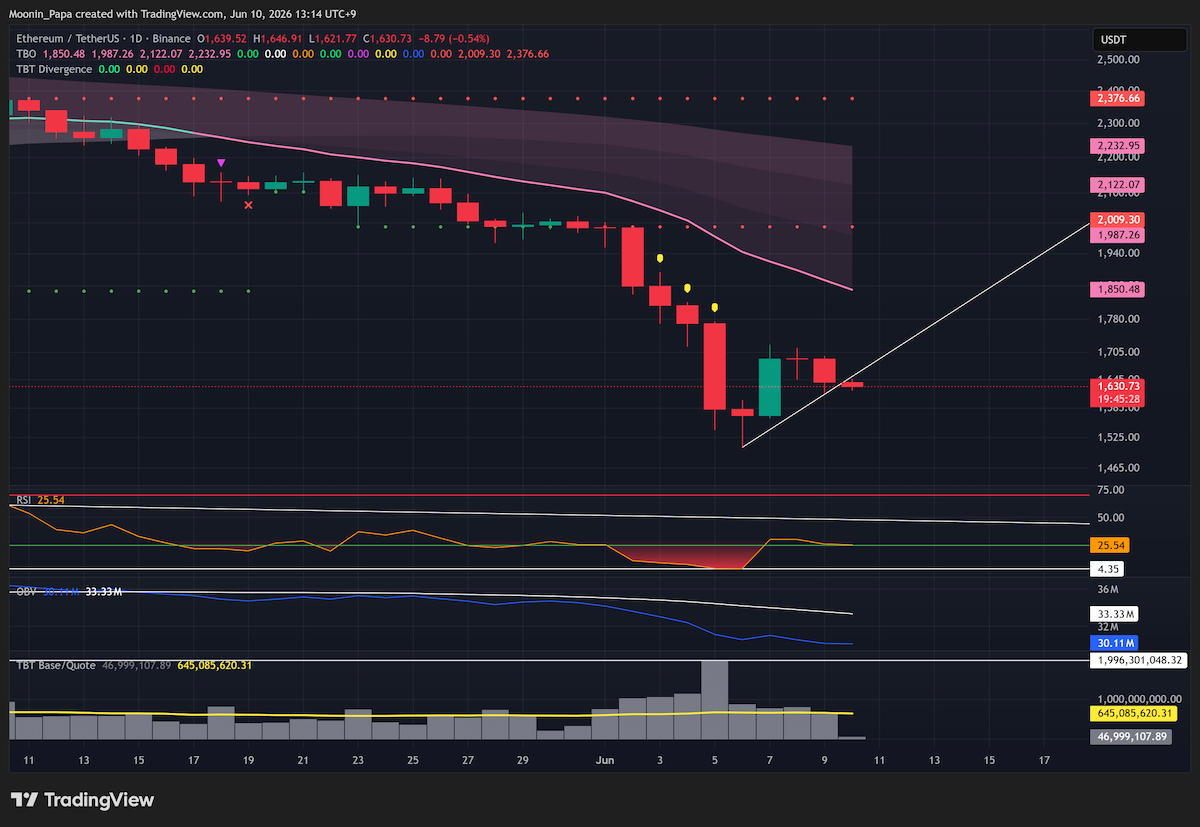
Ethereum also weakened, closing down just over 3% on…