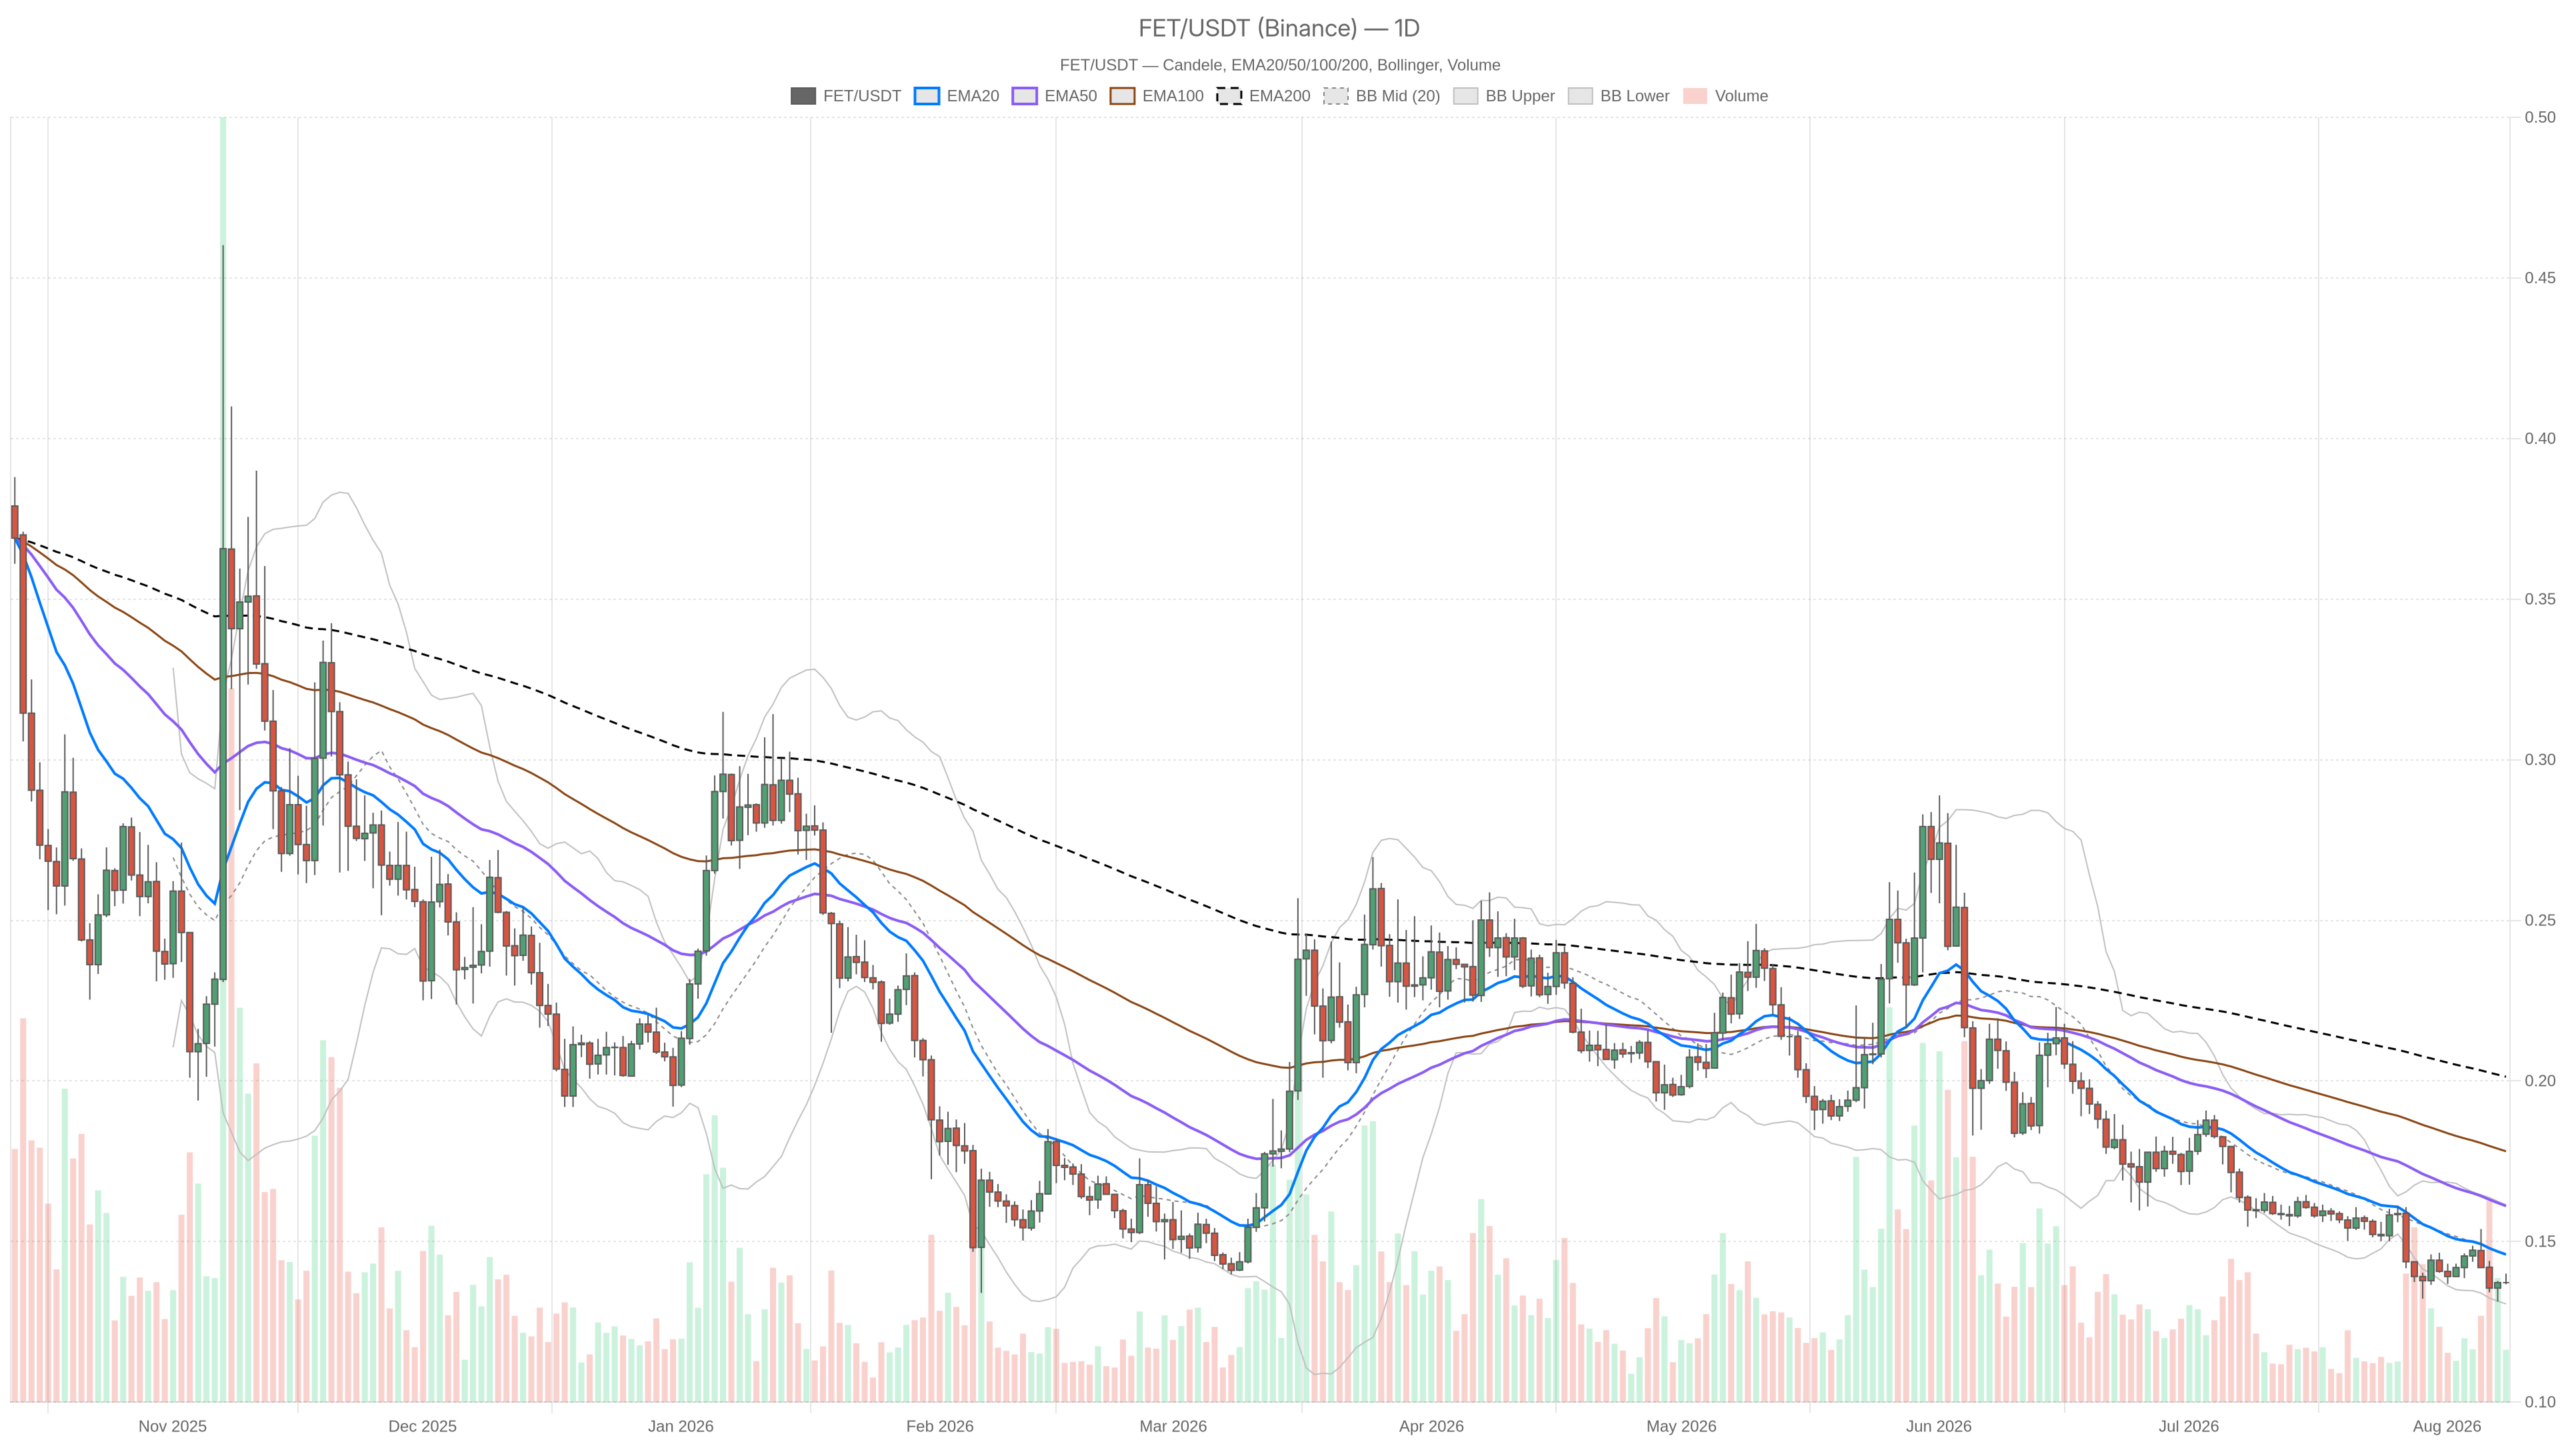
As of August 8, 2026, the FET/USDT pair trades near $0.14 with every major moving average stacked above it. The Artificial Superintelligence Alliance crypto chart reflects a bearish regime shaped by fear, thinning volume, and compressed volatility that refuses to resolve.
Key takeaways
- FET/USDT trades at roughly $0.14, below its 20-day EMA ($0.15), 50-day ($0.16), and 200-day ($0.20) moving averages.
- Daily RSI sits at 36.6 and MACD remains negative with a flat histogram, confirming bearish momentum across the daily timeframe.
- The Fear & Greed Index reads 30, while 24-hour market-wide volume has contracted by roughly 39%, according to CoinGecko data.
- Bollinger Bands…