AAPL Elliott Wave technical analysis
Function: Counter Trend.
Mode: Corrective.
Structure: Flat.
Position: Wave {ii} of C.
Direction: Expected downside in wave {iii}.
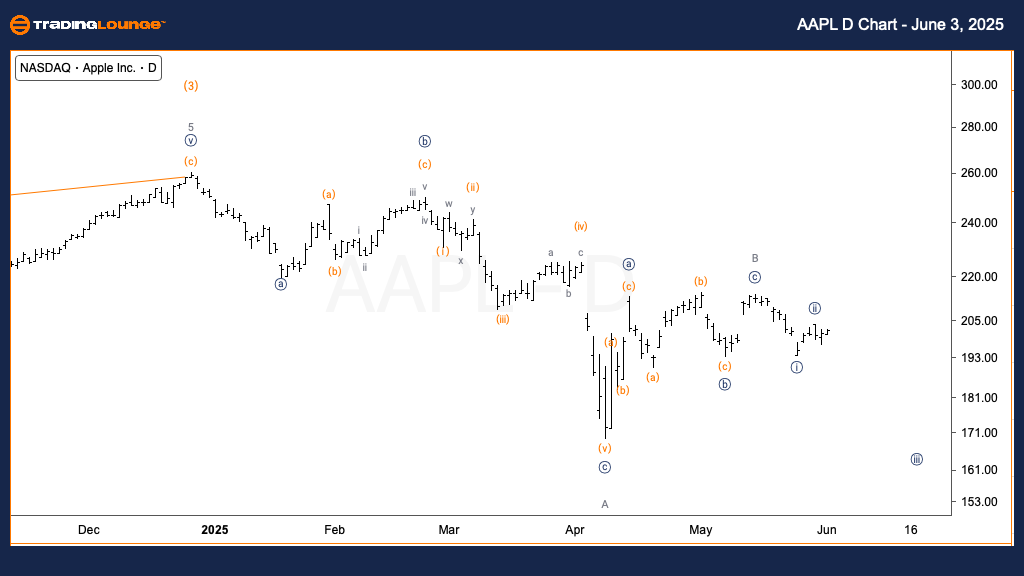
Details: Monitoring price resistance above $200 to validate the start of Minor wave C, which aims to complete Intermediate wave (4)
The daily chart analysis for Apple Inc. (AAPL) shows the stock in a corrective flat pattern. It currently sits within Minor wave C, anticipated to finalize a broader Intermediate wave (4). Confirmation of the bearish wave count hinges on price rejection at the $200 level. If AAPL fails to break above this key resistance, it would support a downside move into wave {iii} of C.
Apple Inc. (AAPL) daily chart