TradingKey – As of the close on October 26, Eastern Time, Tesla (TSLA) stock surged 5.21% to close at $391.62, reaching a high of $397.27. Since hitting a low of $349.33 on October 16, Tesla’s stock price has rebounded by about 12%, re-approaching the $400 psychological mark, with its short-term price structure improving noticeably compared to before.
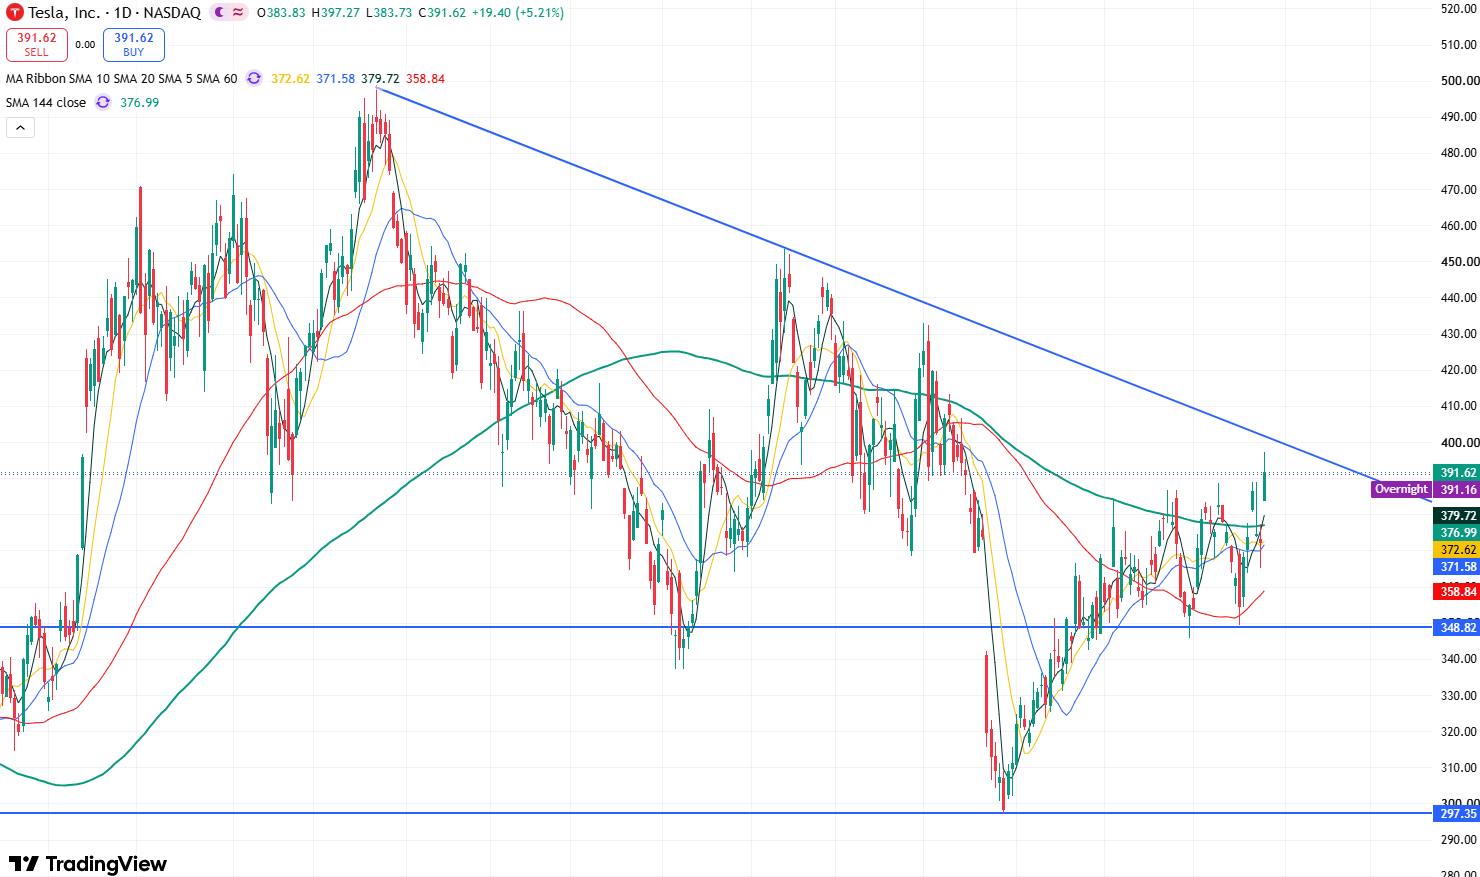
Tesla stock daily chart. Source: TradingView
Judging from Tesla’s daily price chart, as the stock broke through the short-term resistance level of $390 and reclaimed major moving averages including the 5-day, 10-day, 20-day, 60-day, and 144-day lines, the short-to-medium-term moving average structure has improved. The bullish momentum has been further strengthened, and the stock is expected…