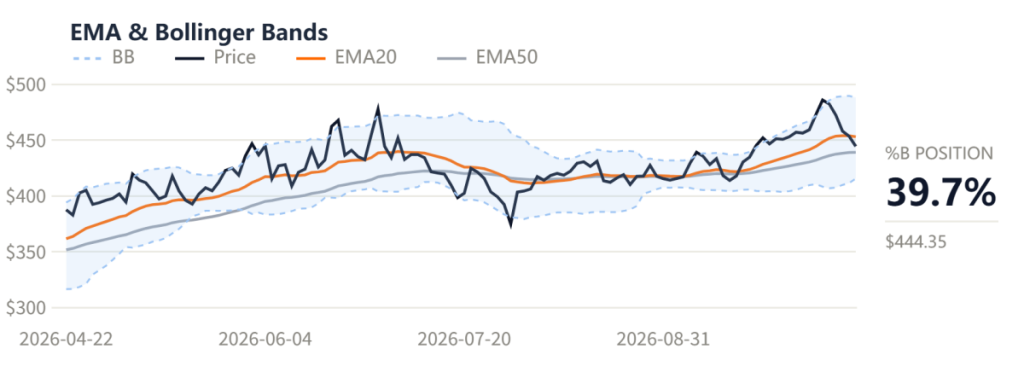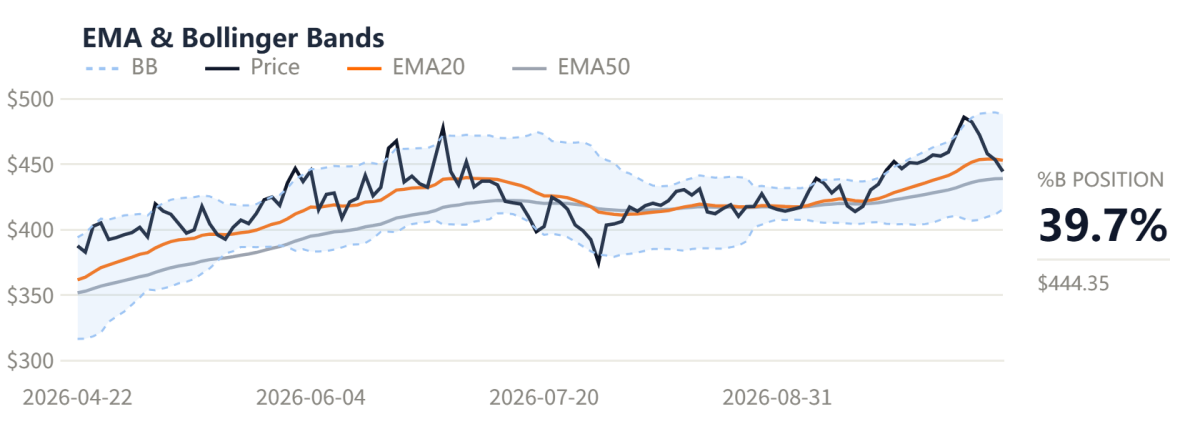
The Bollinger Band middle rail at 451.79 nearly coincides with EMA20, and the price is trading between the middle rail and the lower rail at 415.51, placing it in the weaker half of the band. A bandwidth of 16.1% indicates volatility remains elevated, and combined with a high Beta of 2.092, once the lower rail is tested, single-day swings could rapidly amplify. The current price still has about 6.5% of room above the lower rail, suggesting short-term choppy decline below the middle rail rather than an immediate breakdown.
RSI at 47.6 sits squarely in neutral territory, neither oversold nor showing divergence, consistent with the characterization of a “pullback within an uptrend.” Notably, five consecutive days of declines have not pushed…