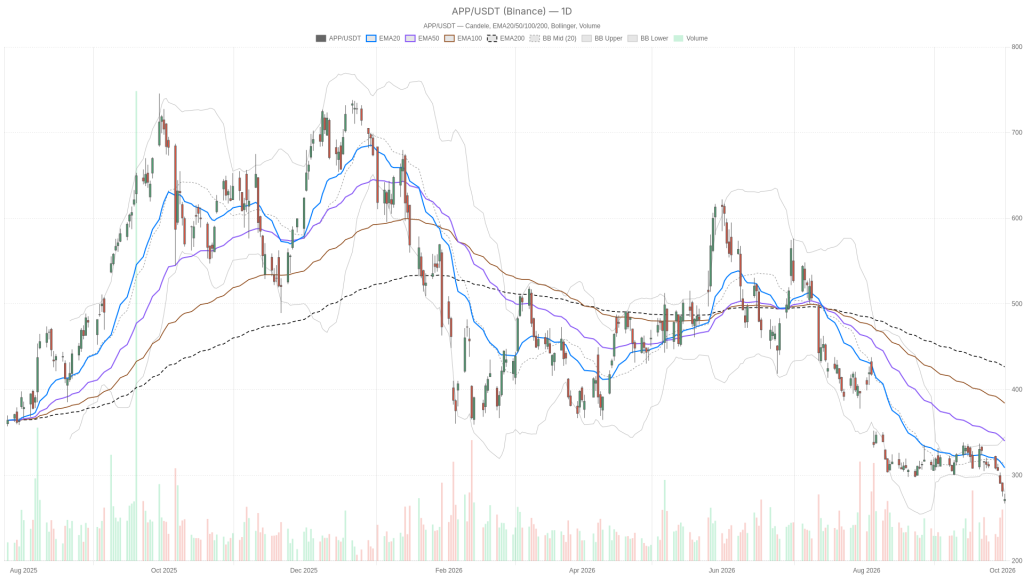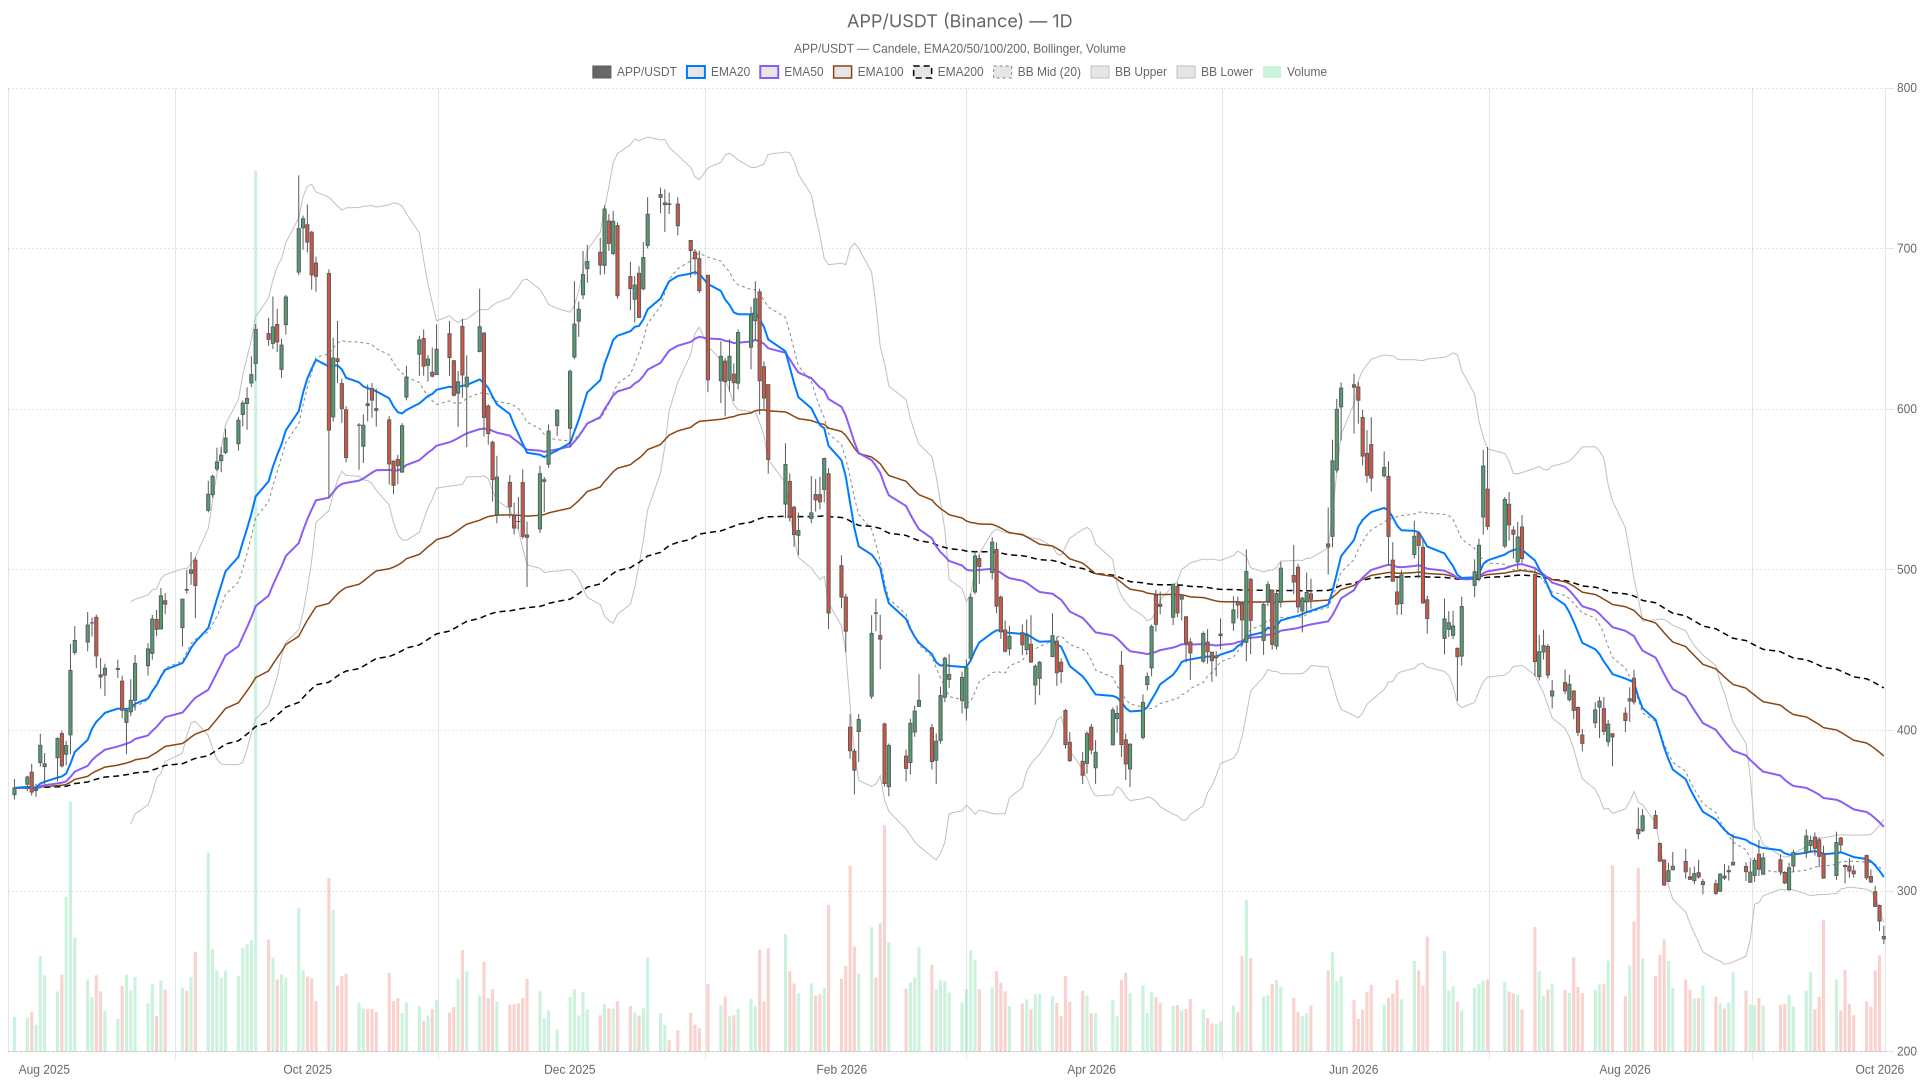
AppLovin stock is under renewed pressure on Friday, trading at $271.72 as of 09:46 ET, down 3.41% against Thursday’s close of $281.31. The daily and hourly charts show a stock locked in a downtrend. Only the 15-minute chart hints at a short-lived pause in selling momentum.

Key takeaways
- AppLovin stock was trading at $271.72 as of 09:46 ET on Friday, down 3.41%, below the daily S1 support at $273.78.
- Daily RSI14 at 29.28 and hourly RSI14 at 20.34 both sit firmly in oversold territory, with MACD still negative on both timeframes.
- Price trades below the daily lower Bollinger band at $280.51 and beneath every key EMA across daily and hourly charts.
- The 15-minute MACD…