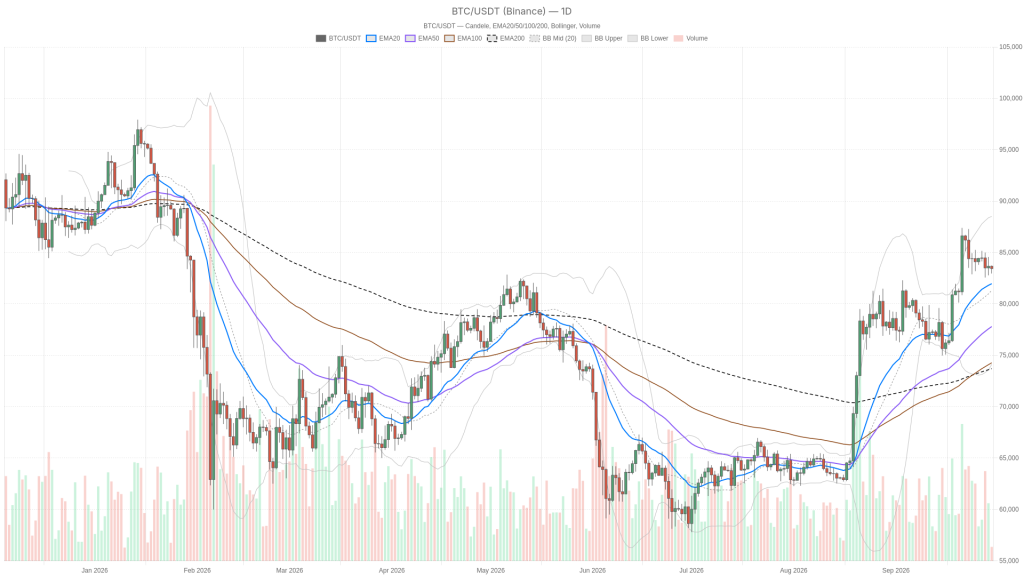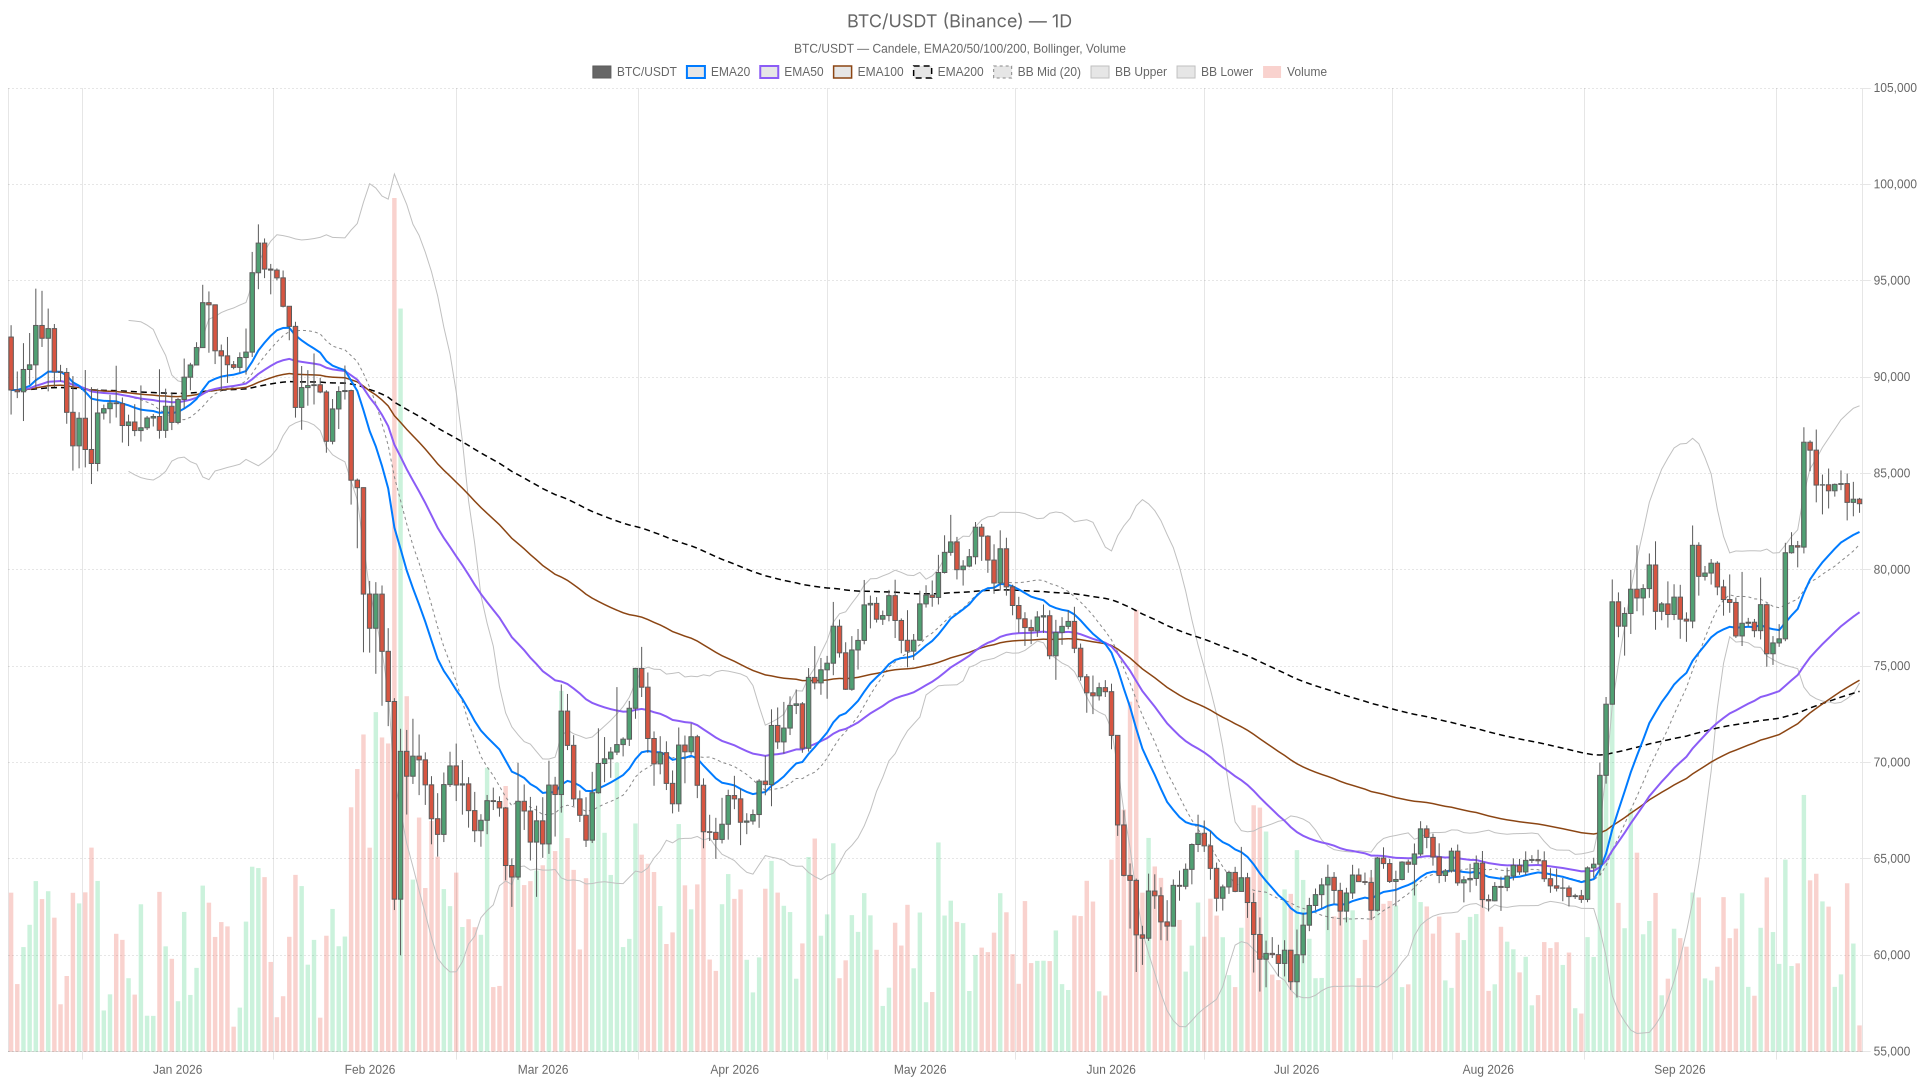
What the daily chart reveals about current price levels
The daily chart confirms a structurally bullish regime, with price trading above all three key exponential moving averages. Bitcoin at $83,430 sits above the EMA20 ($81,964), EMA50 ($77,799), and EMA200 ($73,693) — a textbook bullish stack that the system’s regime read confirms as bullish. That EMA200 resting nearly 13% below spot underscores how far this move has already traveled, which matters when deciding whether to chase strength or wait for a pullback.
RSI14 on the daily is at 60.26 — constructive momentum without being stretched, leaving room for the trend to keep grinding higher. However, the MACD tells a slightly different story: the line at 2060.05 against a signal…