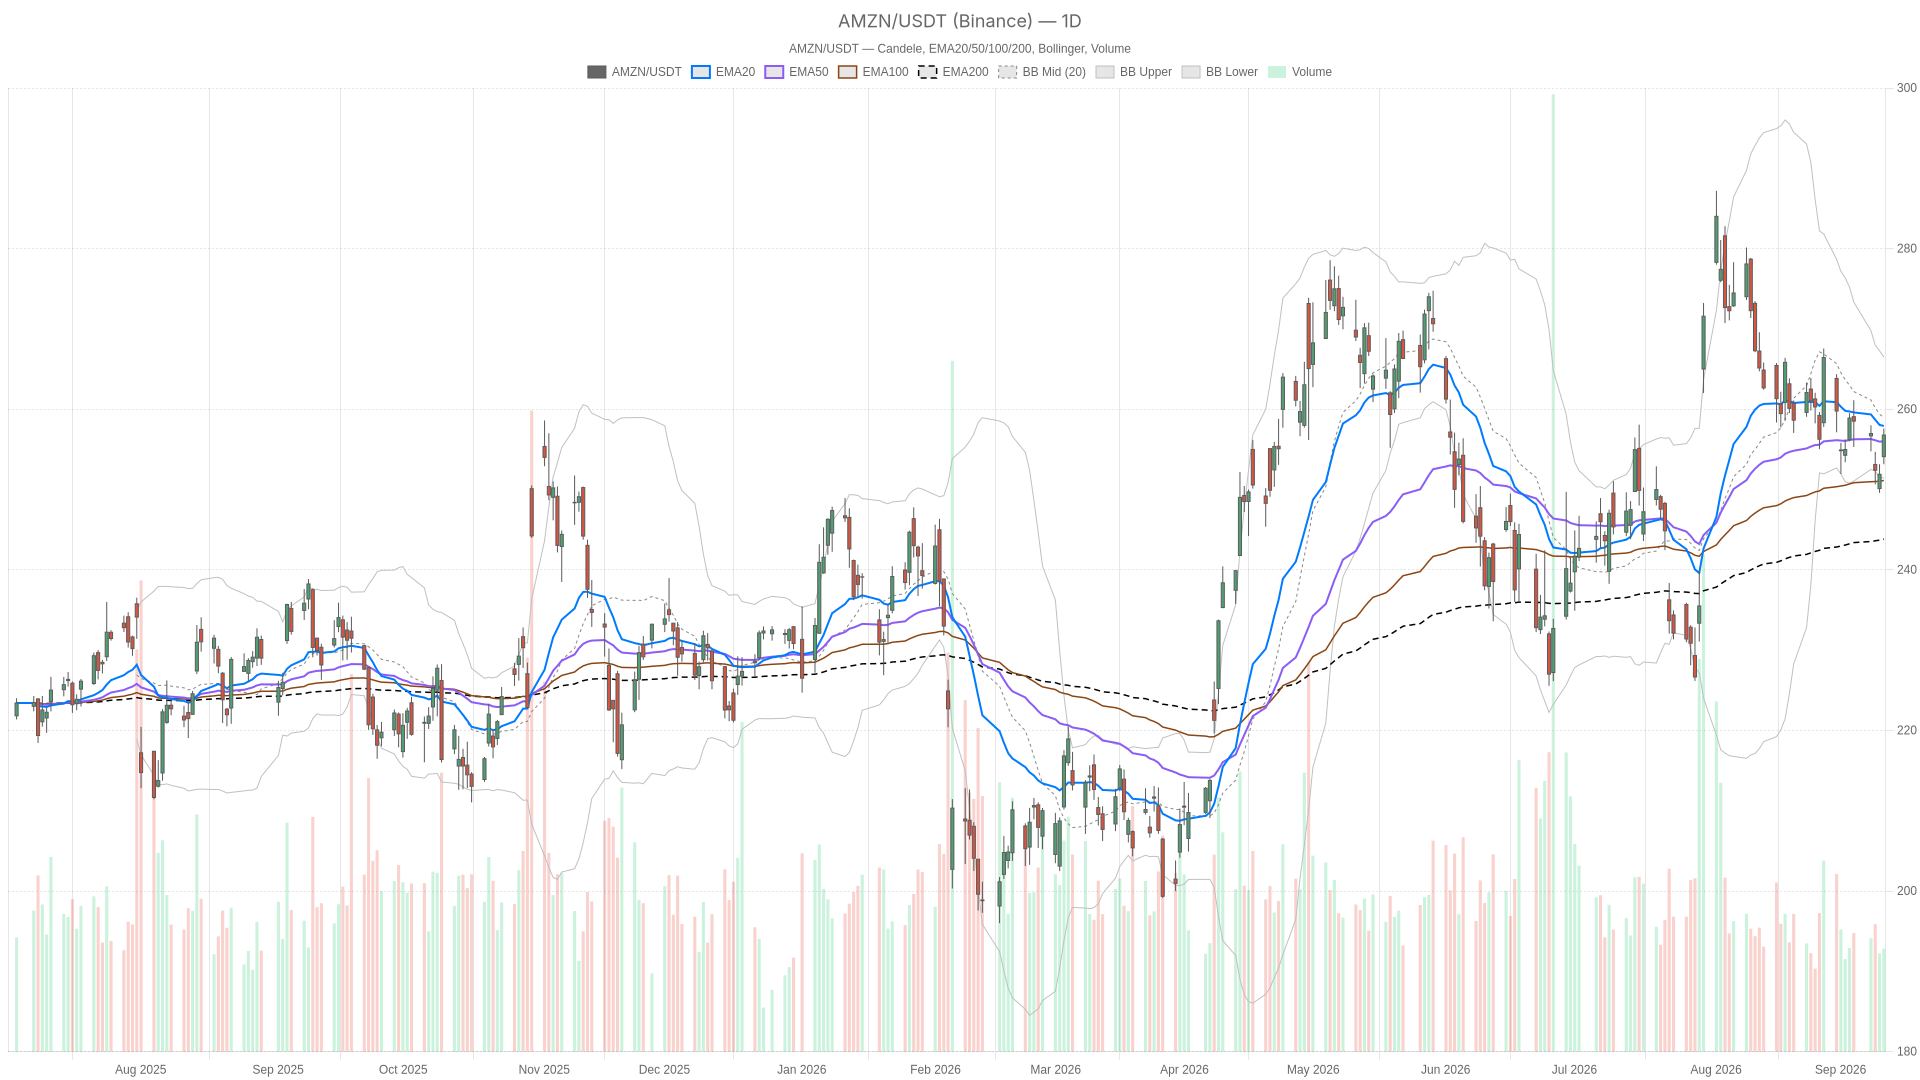
Amazon stock sits at a crossroads at $256.78. AMZN trades well above its 200-day EMA of $243.82, confirming the broader uptrend. However, daily momentum has softened near the pivot zone that capped recent advances. Is this a healthy pause or the start of something more corrective?

Key takeaways
- Amazon stock closed at $256.78, roughly 5.3% above its 200-day EMA of $243.82
- Daily RSI at 48.91 signals consolidation rather than trend continuation
- The daily MACD histogram of -1.11 points to fading bullish momentum
- A break above the $258.53 daily R1 pivot is needed for bullish confirmation
- 1H chart strength runs directly into the same resistance the daily chart has struggled…