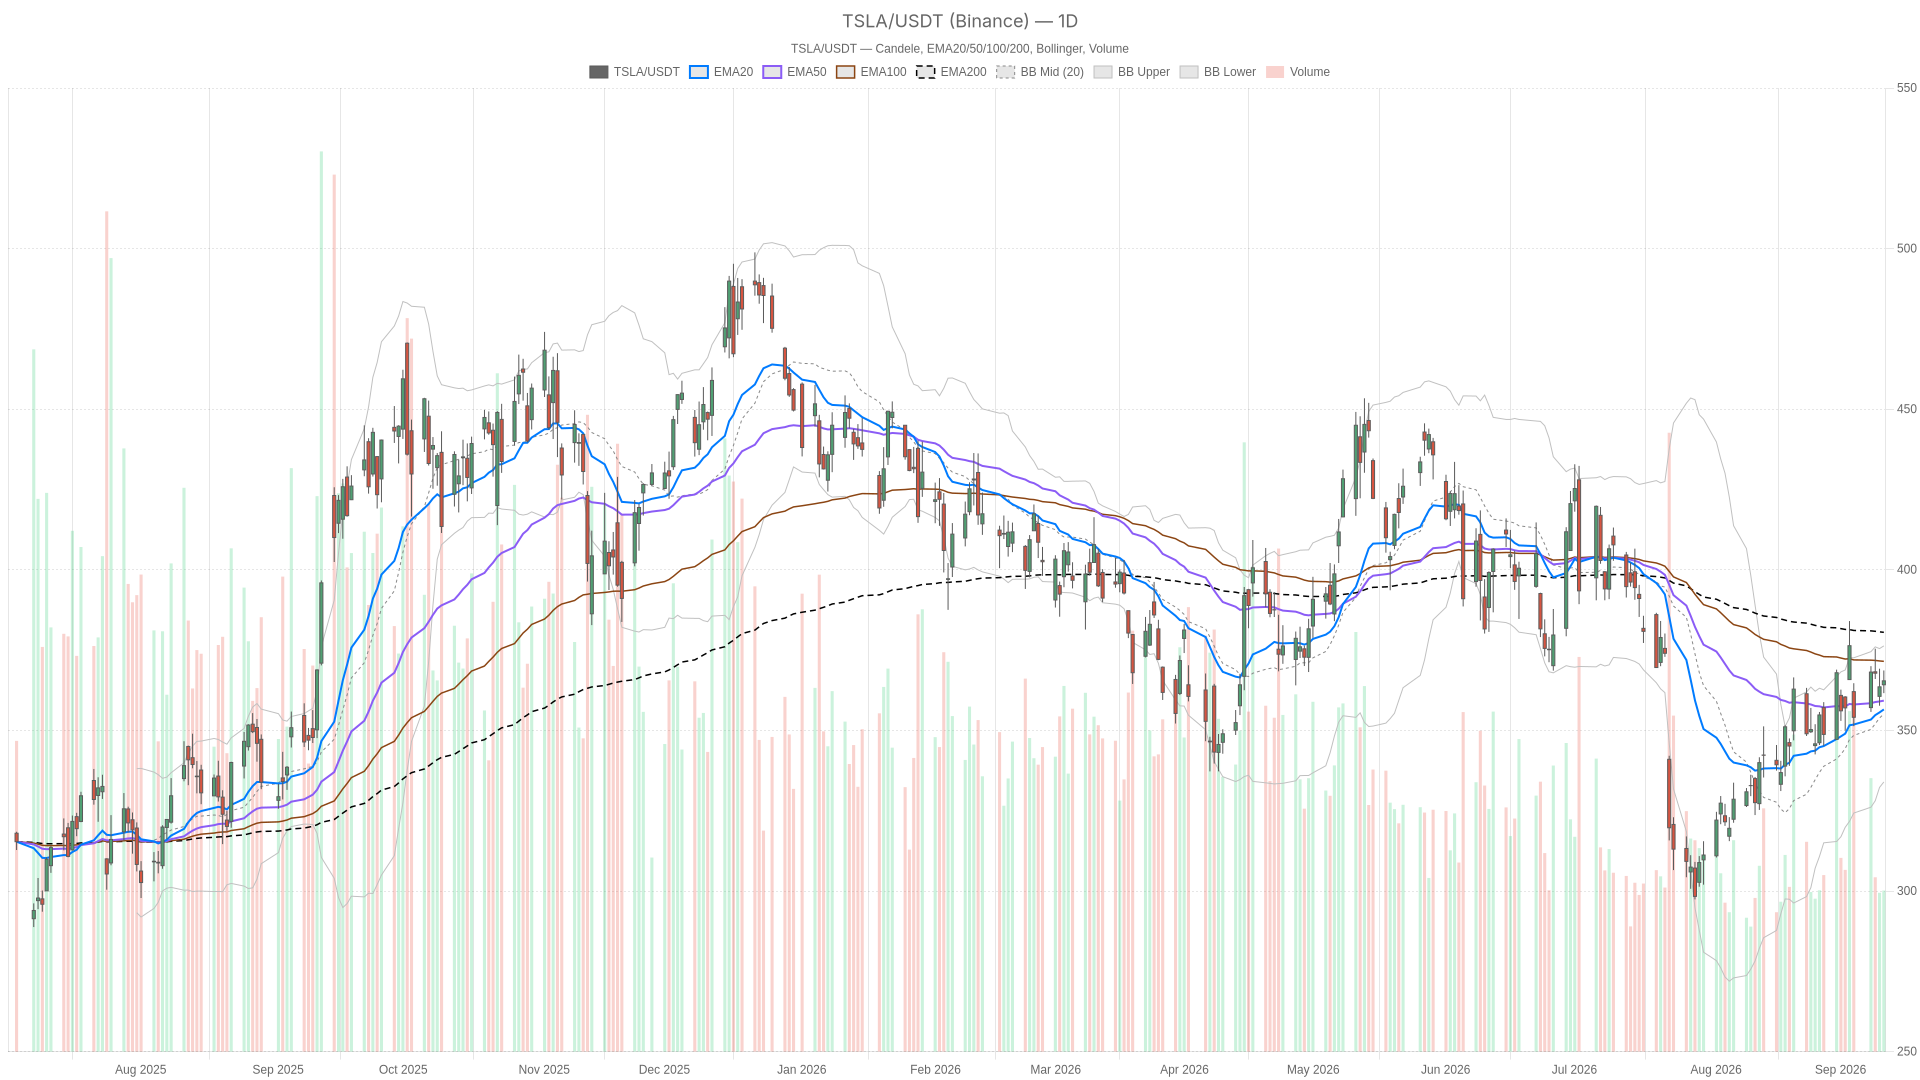
Tesla stock is caught in a familiar tug-of-war. The daily chart shows TSLA has clawed back above short-term moving averages and carries positive momentum. Yet it remains stuck beneath the 200-day EMA. That contrast between near-term strength and structural overhang defines the outlook heading into the next sessions.

Key takeaways
- TSLA closed at 365.44, above its 20-day and 50-day EMAs but still well below the 200-day EMA at 380.53.
- Daily momentum is constructive: RSI14 at 54.45 with a bullish MACD cross (line at 5.05 above signal at 3.19).
- Hourly momentum is stalling: RSI14 flat at 50.02 with MACD histogram turning negative at -0.33.
- The 15-minute chart shows Bollinger…