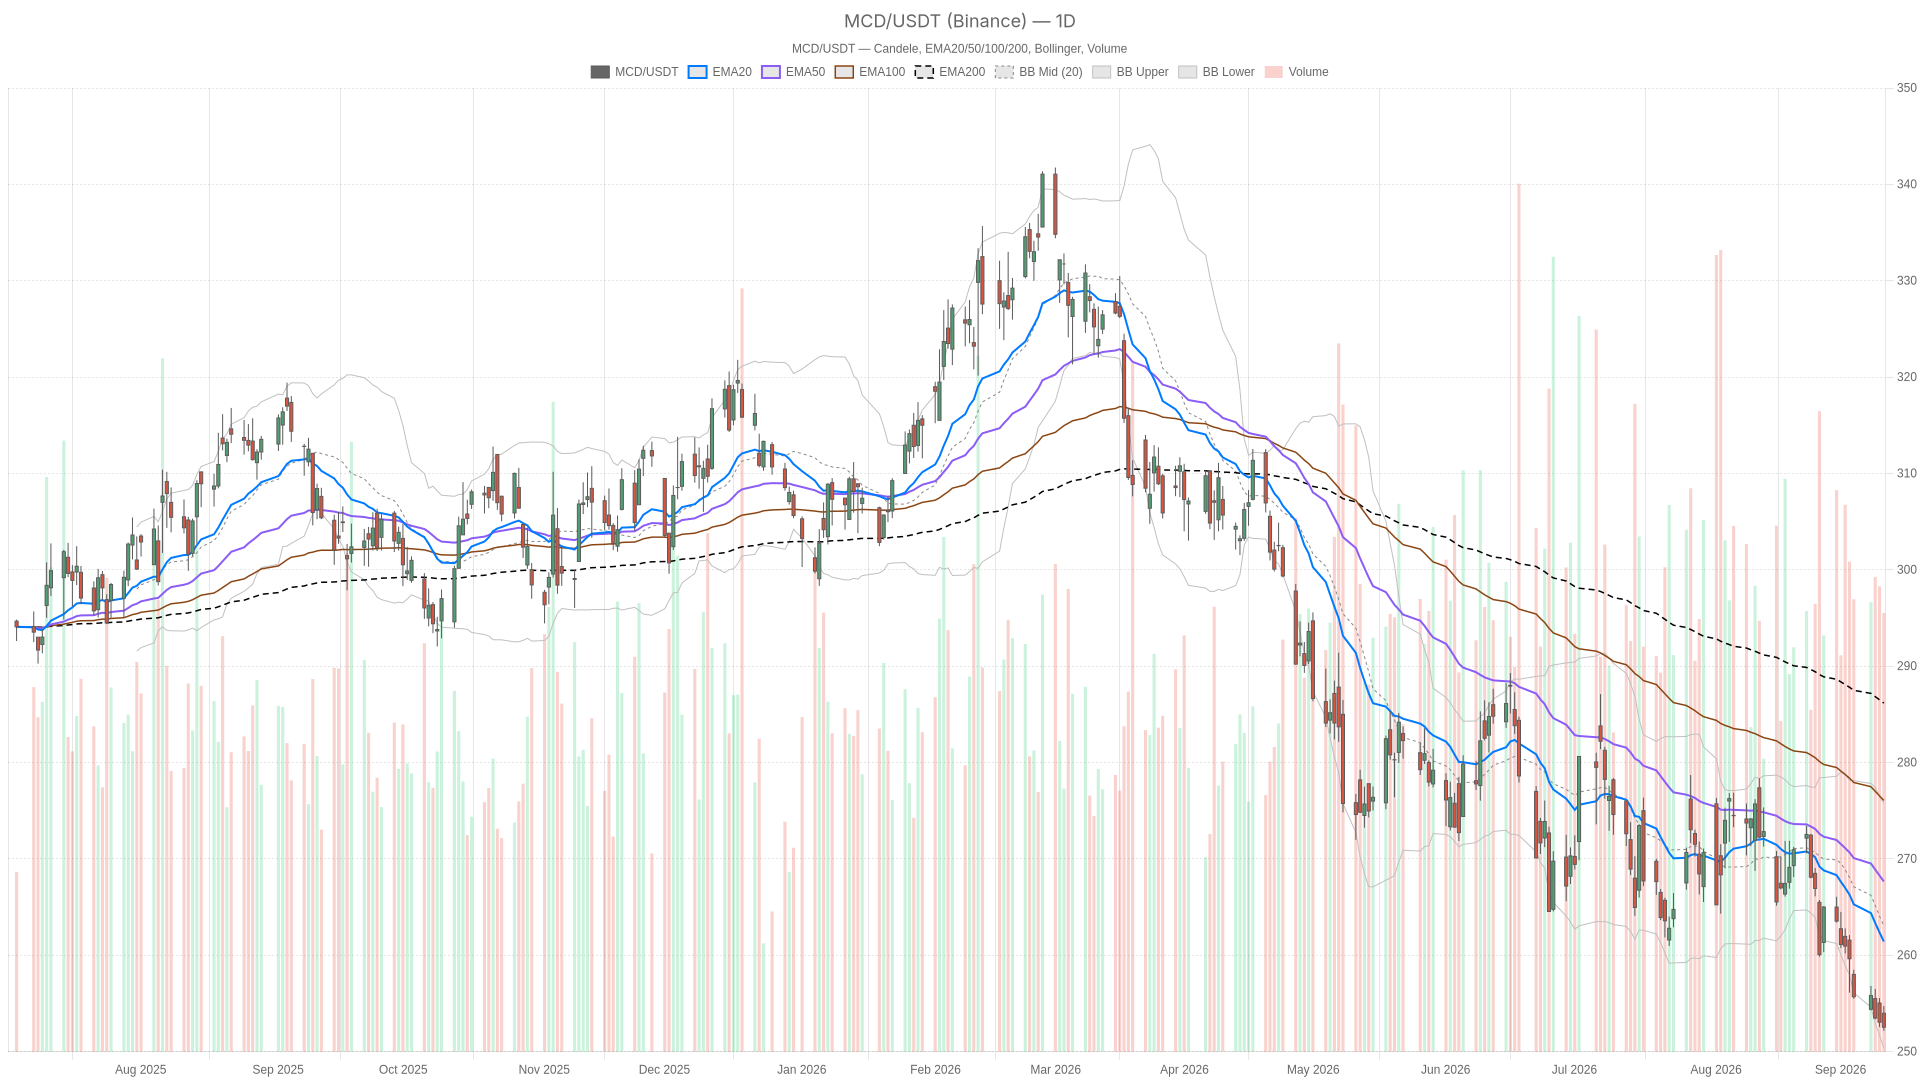
McDonald’s Corporation stock faces mounting technical pressure as shares test fresh 52-week lows near $252.53. The daily chart confirms a bearish regime with price below every major moving average. Momentum readings continue to point lower. This is a market still searching for a floor.

Key takeaways
- MCD closed at $252.53, below the EMA20 ($261.42), EMA50 ($267.65), and EMA200 at $286.16.
- Daily RSI14 at 31.2 nears oversold territory but has not confirmed an exhaustion bottom.
- Daily MACD histogram at -1.21 shows bearish momentum is still expanding rather than fading.
- The 1H MACD histogram has flipped slightly positive at 0.12, hinting at short-term stabilization.
- Q2 US…