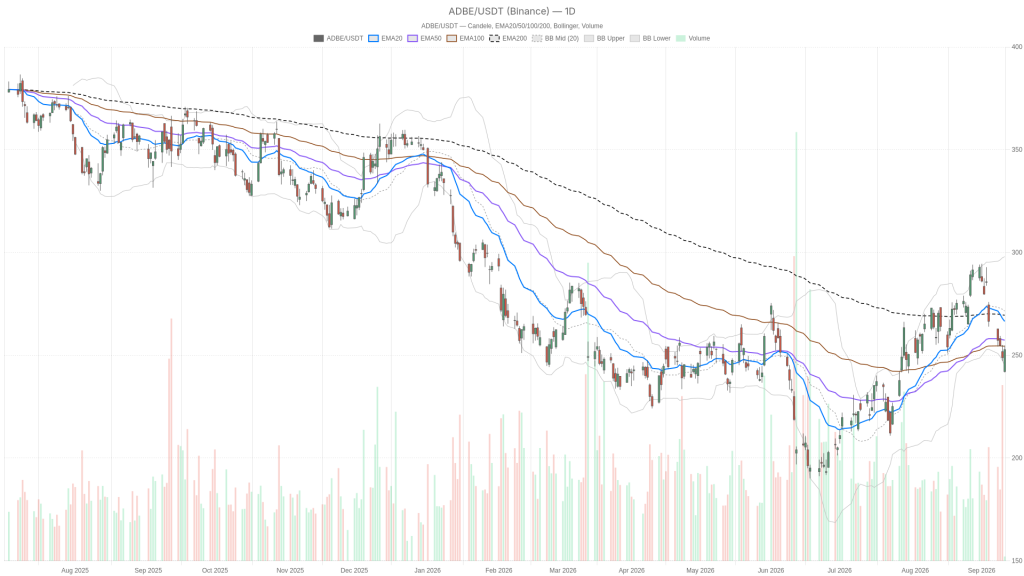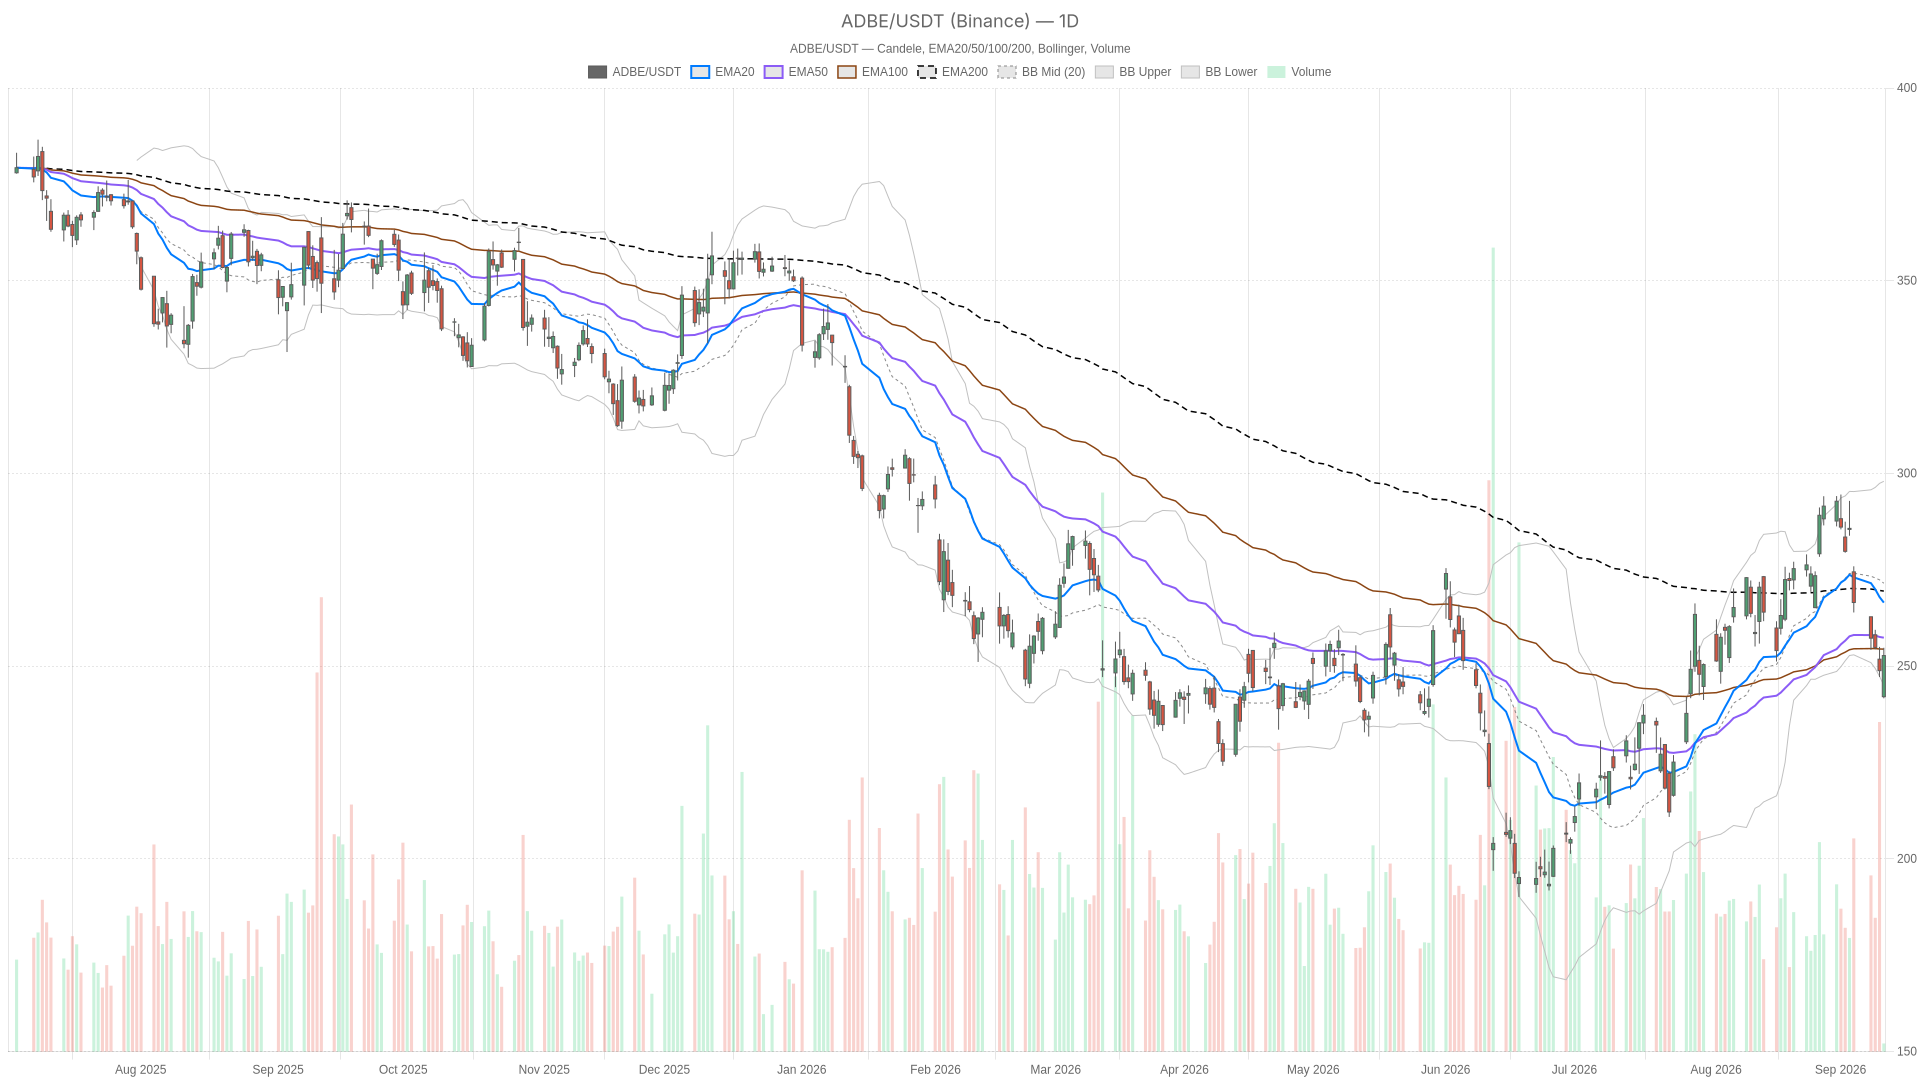
Adobe Inc. stock is at a technical crossroads after its fiscal Q3 2026 report. Shares reversed sharply from $241.66 to close at $252.75 on Friday. The daily trend remains bearish. Yet the earnings beat and the intraday bounce set up a genuine tug-of-war.

Key takeaways
- Adobe Inc. stock closed at $252.75 after bouncing from an intraday low of $241.66 on earnings day.
- The daily chart remains bearish with price below the EMA20 ($266.49), EMA50 ($257.39), and EMA200 ($269.48).
- Daily RSI14 at 42.81 and MACD histogram at -5.16 confirm sellers still control the broader trend.
- Stifel reiterated a Hold rating with a $225 price target, below Friday’s close.
- The 15-minute chart…