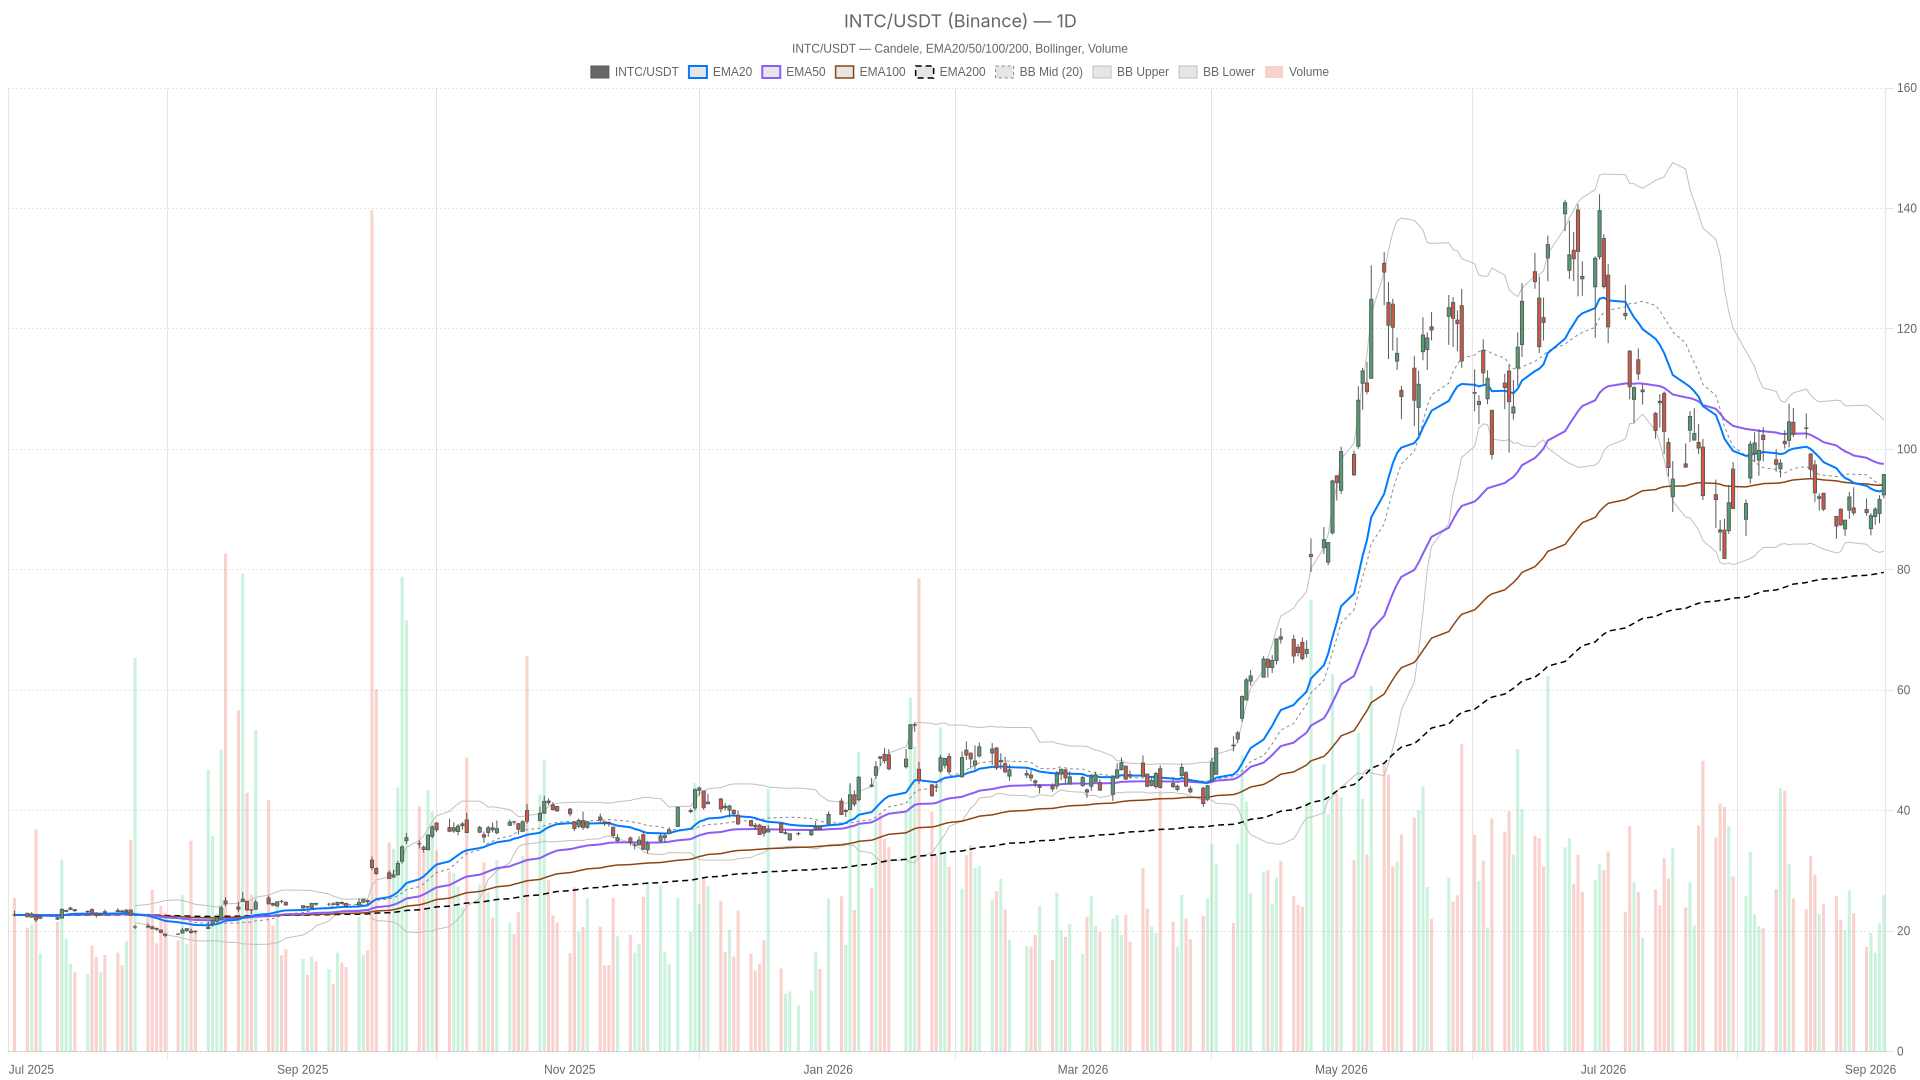
Intel Corporation stock sits at a pivotal juncture after a blistering 2026 rally of over 140%. INTC closed at $95.80, above its 20-day EMA at $93.27 but still capped by the 50-day EMA at $97.59. The next few sessions should clarify whether this recovery has more room to run.

Key takeaways
- Intel Corporation stock has rallied over 140% in 2026, closing at $95.80 on the daily chart.
- Daily structure is neutral but constructive, with price above the 200-day EMA at $79.58 yet below the 50-day EMA at $97.59.
- The 1H chart shows bullish momentum but an overbought RSI at 70.02, signaling a potential near-term pause.
- The key resistance band sits at $97.20–$97.59; support is…