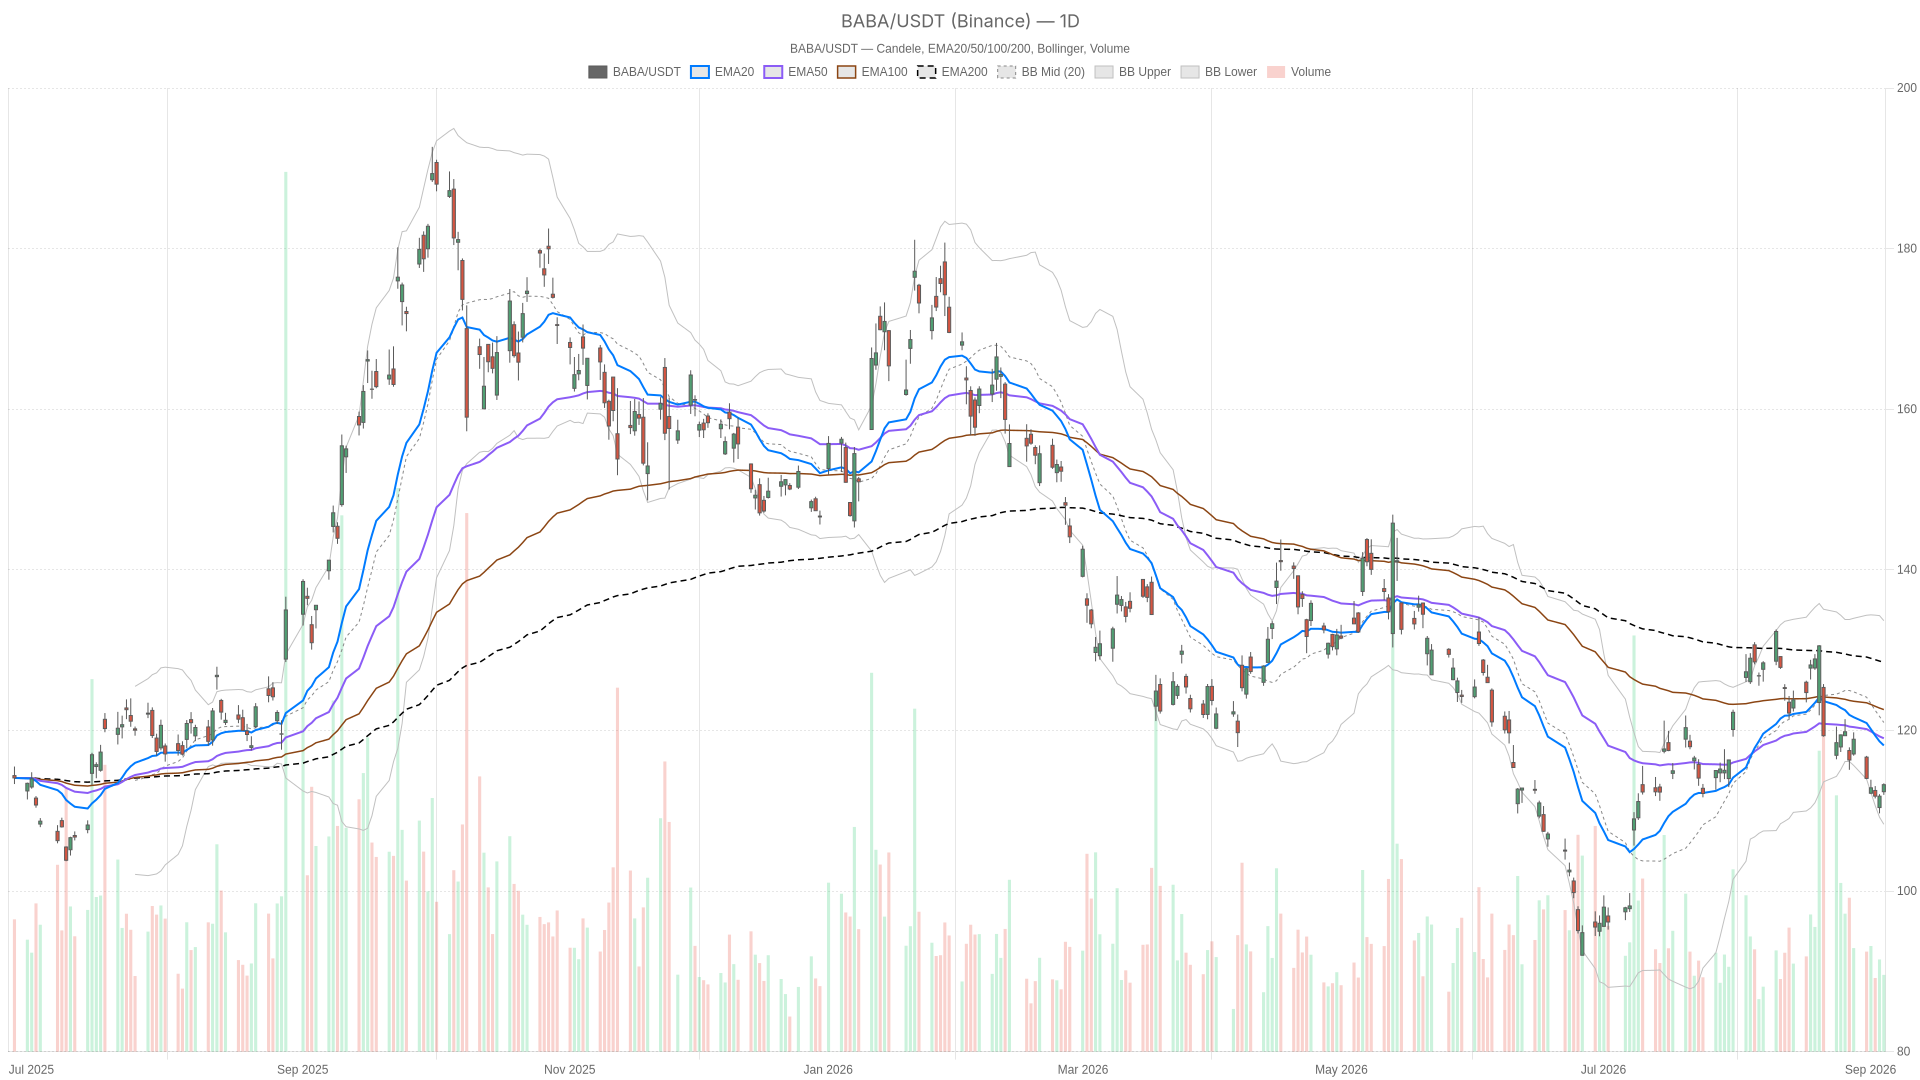
Alibaba stock is trading at a technical crossroads. The daily chart points firmly lower, yet the hourly tape refuses to confirm weakness above the $112 support zone. That tension defines the trade right now.

Key takeaways
- Alibaba stock closed at $113.24 on September 4 with a bearish daily regime confirmed by price trading below all three major moving averages.
- The daily MACD histogram at -1.56 shows bearish momentum is still building, not fading.
- The hourly chart paints a neutral picture with RSI at 52.43, complicating the broader bearish narrative.
- A break below daily S1 support at $112.34 would open the door toward the lower Bollinger band near $108.30.
- A bullish…