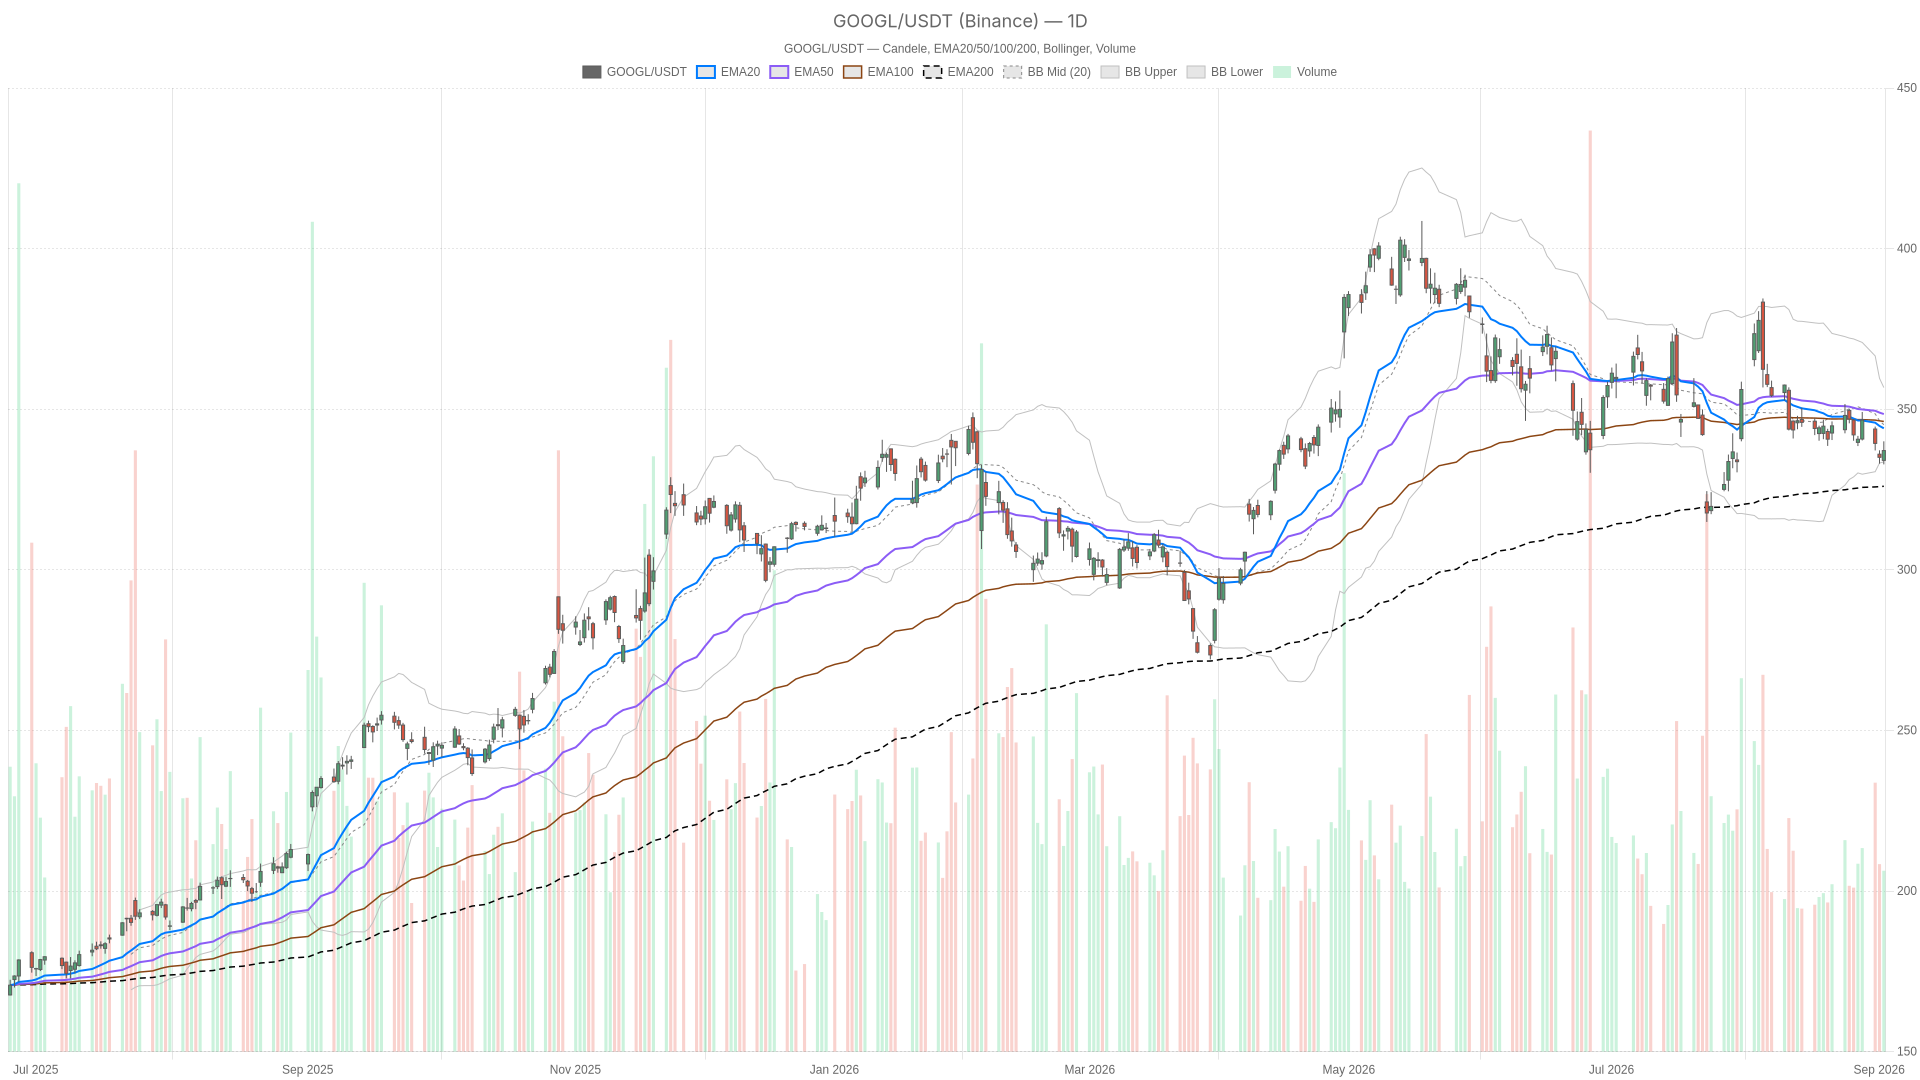
Alphabet stock closed at 337.12 on September 2, below the 20-day EMA of 344.05 and 50-day EMA of 348.48, yet above the 200-day EMA at 326. The broader uptrend holds, but the recent pullback has been steep and now faces an early hourly stabilization attempt.

Key takeaways
- Alphabet stock RSI14 sits at 43.14 on the daily chart, below the neutral 50 line but not yet at exhaustion
- Daily MACD histogram at -0.78 continues to widen to the downside, confirming seller control
- Price hovers near the daily pivot at 336.65 — a critical line-in-the-sand level across timeframes
- Hourly MACD has crossed bullish (line at -1.12 vs signal at -1.48), but the hourly EMA stack remains…