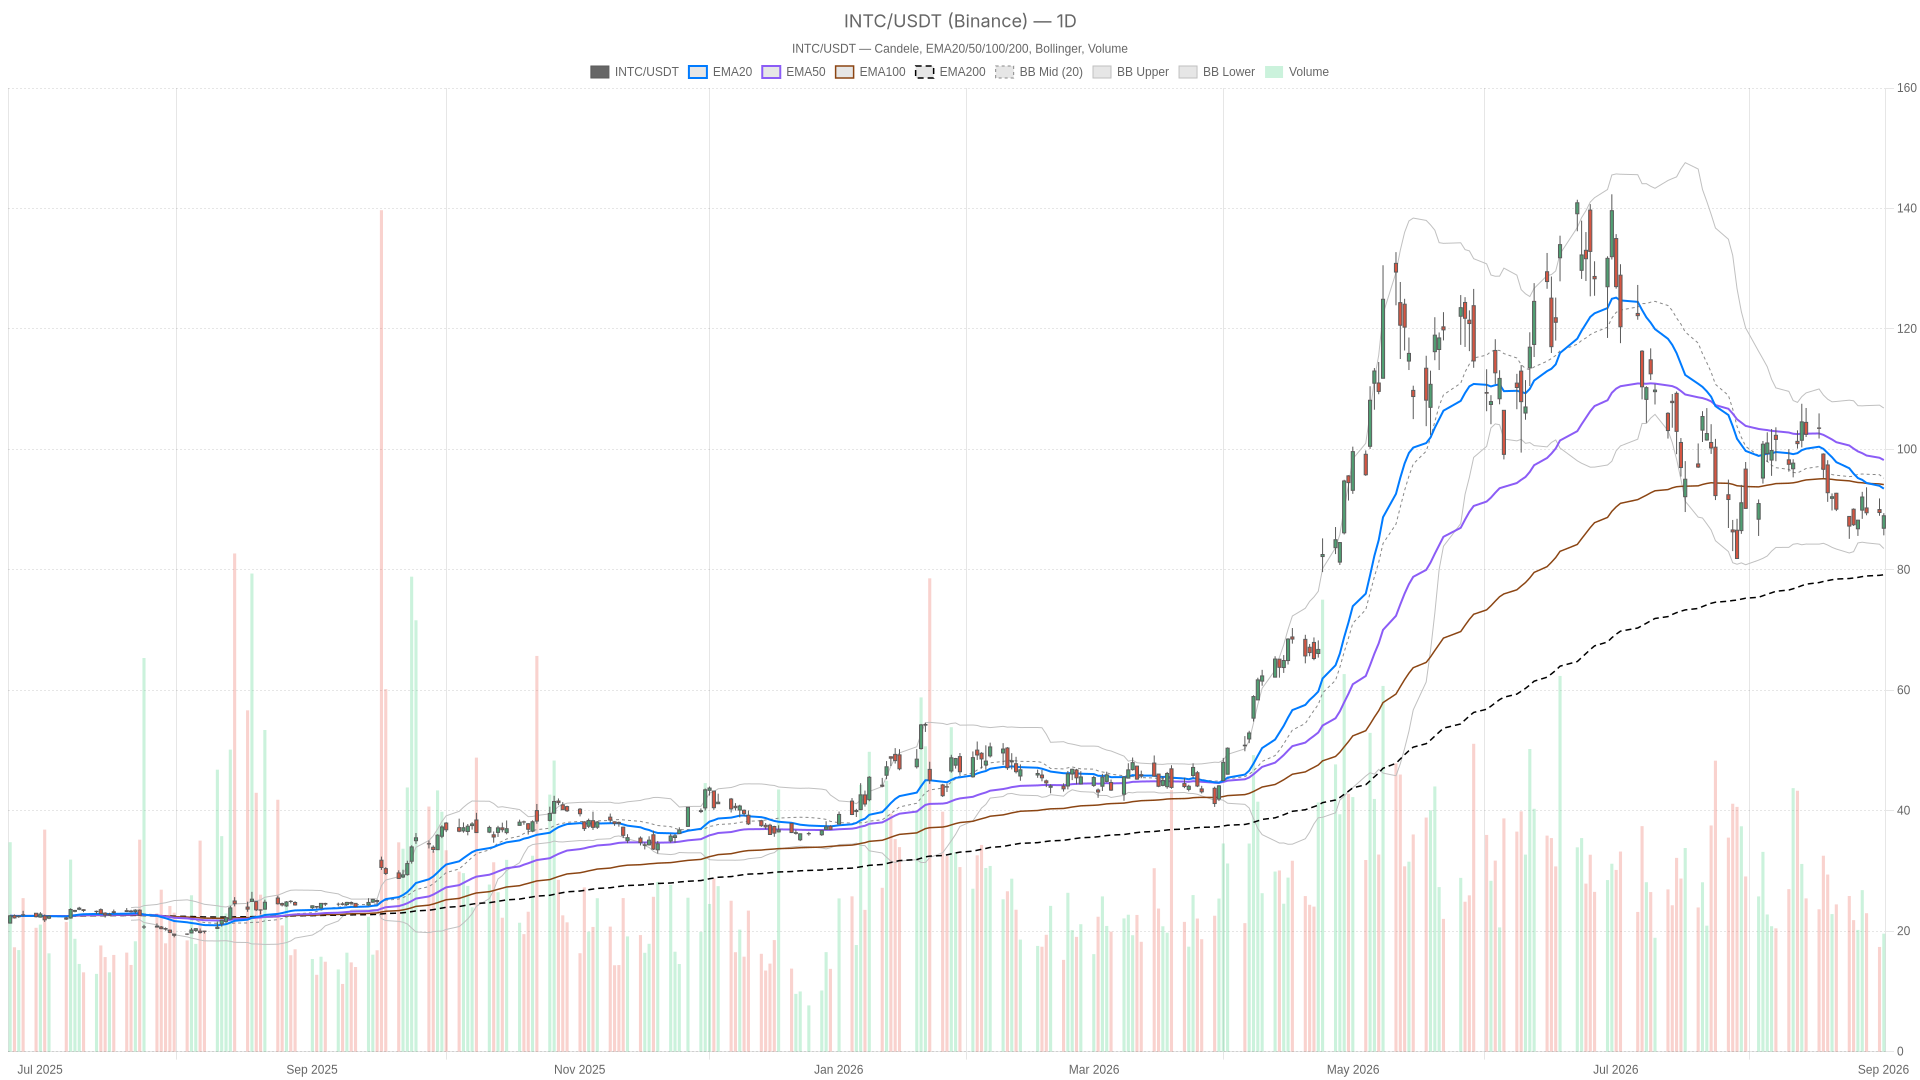
Intel stock closed at $88.97 on September 1, caught between a longer-term uptrend and a short-term momentum breakdown. Higher Treasury yields weighed on chip names broadly, and Intel was no exception, per The Motley Fool. The result: a stock at a technical crossroads, with conflicting signals across timeframes.
Key takeaways
- Intel stock closed at $88.97 on September 1, trading below its 20-day and 50-day EMAs
- The 200-day EMA at 79.18 holds firm, keeping the longer-term uptrend technically intact
- Daily RSI14 at 40.95 signals fading momentum without reaching oversold territory
- Hourly chart shows an explicit bearish regime with price below all key moving averages
- The…