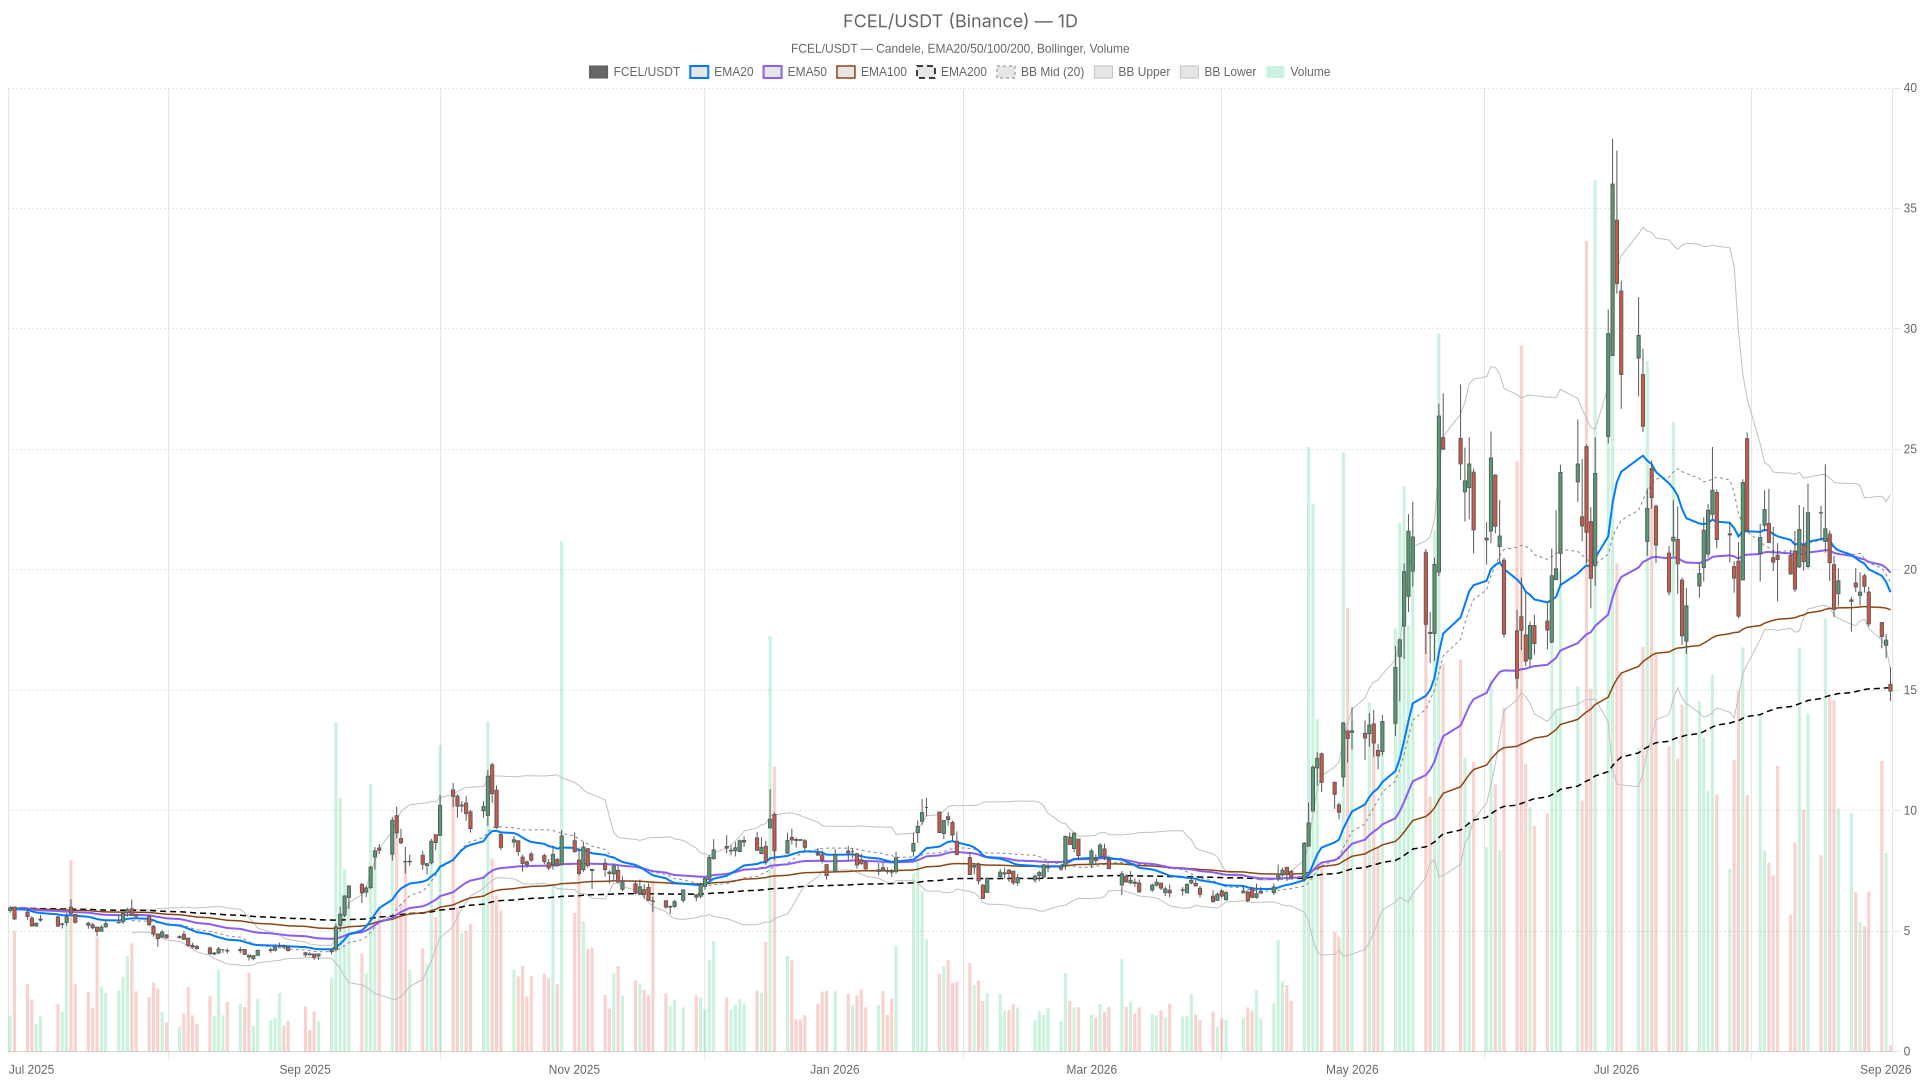
FuelCell Energy, Inc. stock closed at $14.97, almost exactly on the 200-day EMA at 15.10. This turns the level into the chart’s most critical reference point. The proximity explains the neutral daily regime reading, even as most indicators lean bearish.
Key takeaways
- FCEL closed at $14.97, sitting precisely on the 200-day EMA at 15.10
- Daily RSI14 at 35.05 signals weak momentum without reaching oversold territory
- Hourly RSI14 at 21.22 is firmly oversold, while daily MACD remains negative at -1.20
- Price trades below the lower daily Bollinger Band at 15.87, indicating a downside stretch
- Q2 earnings results have been announced, adding clarity to the technical setup…