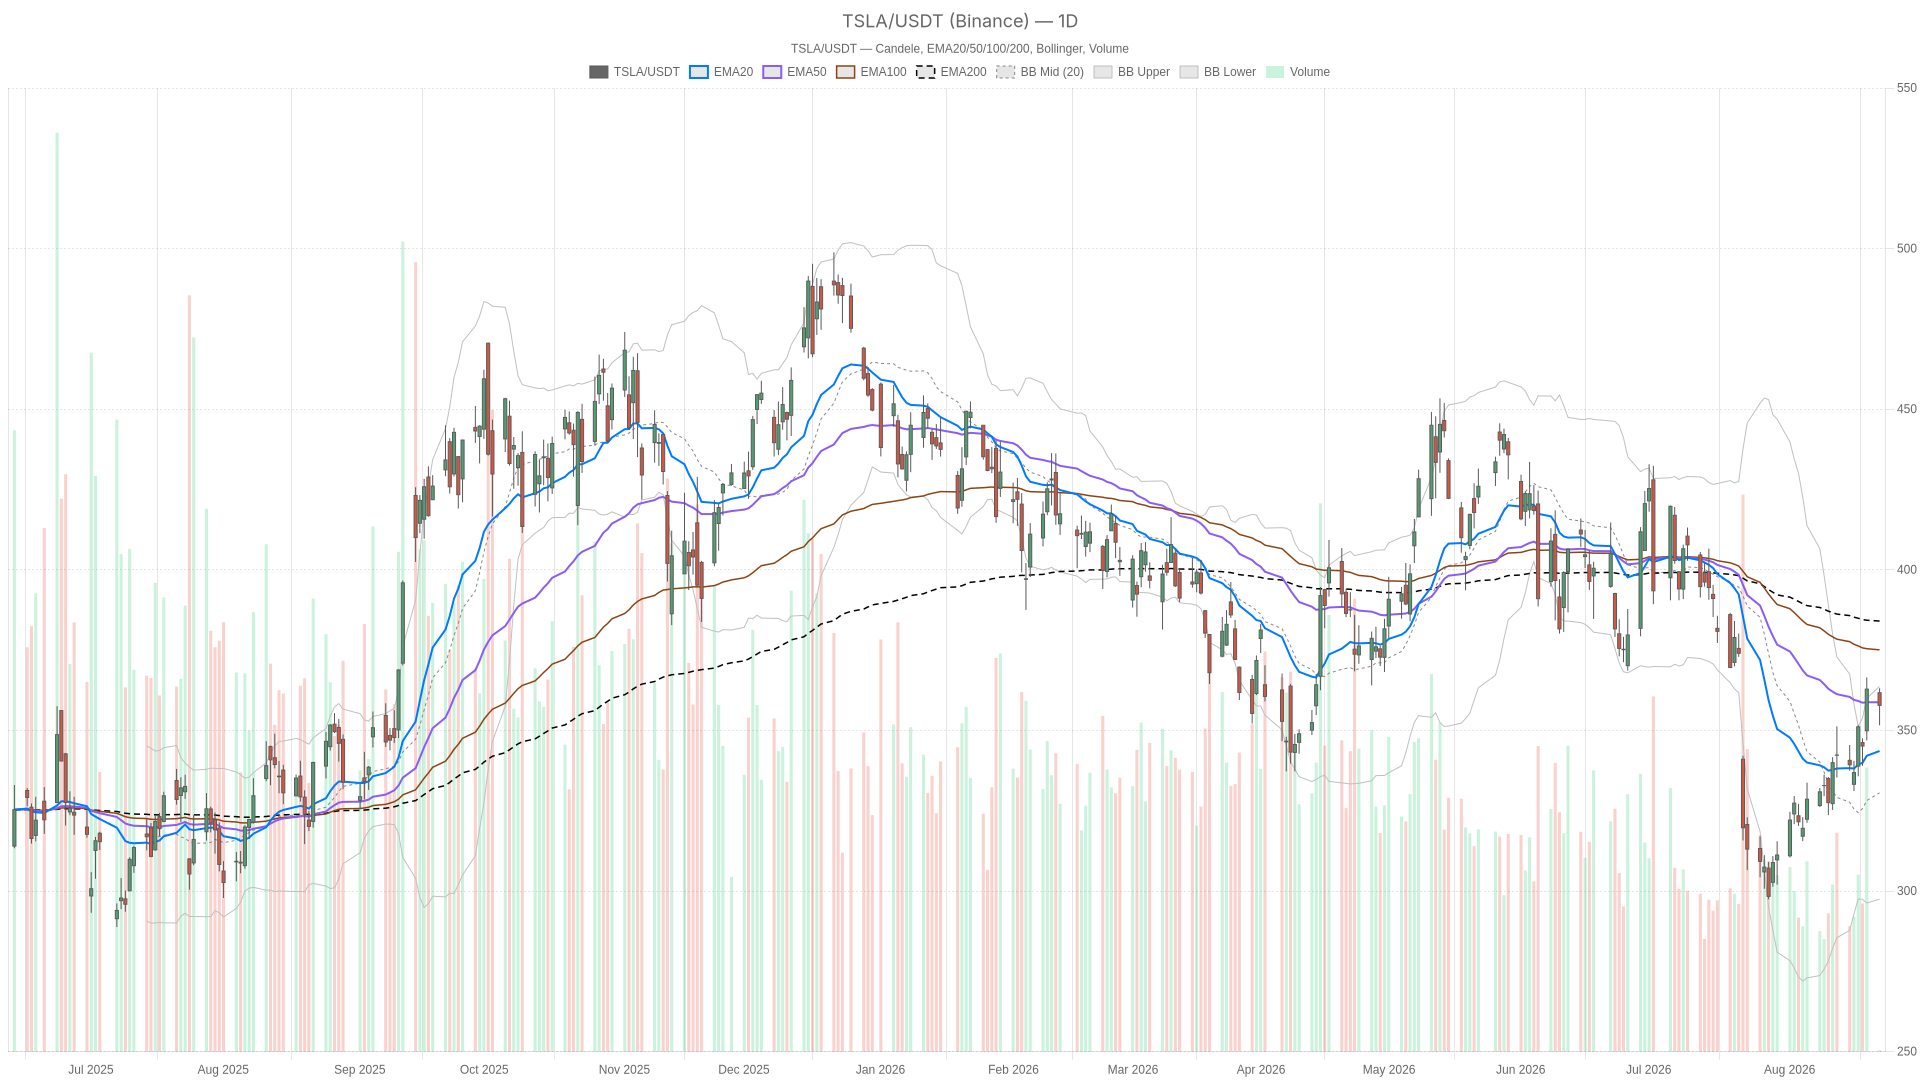
Tesla stock is caught between daily resistance and rising support. The hourly chart leans bullish while the daily timeframe remains neutral. This divergence defines the setup as Tesla navigates robotaxi regulatory news and broader market caution ahead of Nvidia earnings.
Key Takeaways
- Tesla stock closed at 357.78, sitting almost exactly on the daily pivot at 357.50 — a level reflecting indecision.
- The hourly chart shows a bullish alignment with price above the 20, 50, and 200-hour EMAs, diverging from the neutral daily picture.
- Daily RSI at 55.38 and a positive MACD histogram at 6.20 suggest downside momentum is fading, though the trend has not yet flipped…