
A Review of Nokia’s Price Action Over the Past Decade
TradingKey – From 2016 to present, Nokia (NOK) has gone through four core stages over the past decade: volatile decline, post-surge pullback, bottoming out, and another surge.
From 2016 to 2019, Nokia’s stock price was generally in a volatile downward trend. At the beginning of 2016, after starting at $7.5, Nokia stock continued to weaken amidst volatility and fell to a low of $3.3 by the end of 2019. From 2020 to 2021, Nokia experienced a meme stock frenzy; its share price first plummeted to near $2.3 and then surged continuously, reaching $9.70 in less than a year, before falling back rapidly to trade on fundamentals, fluctuating within the $4–$6 range.
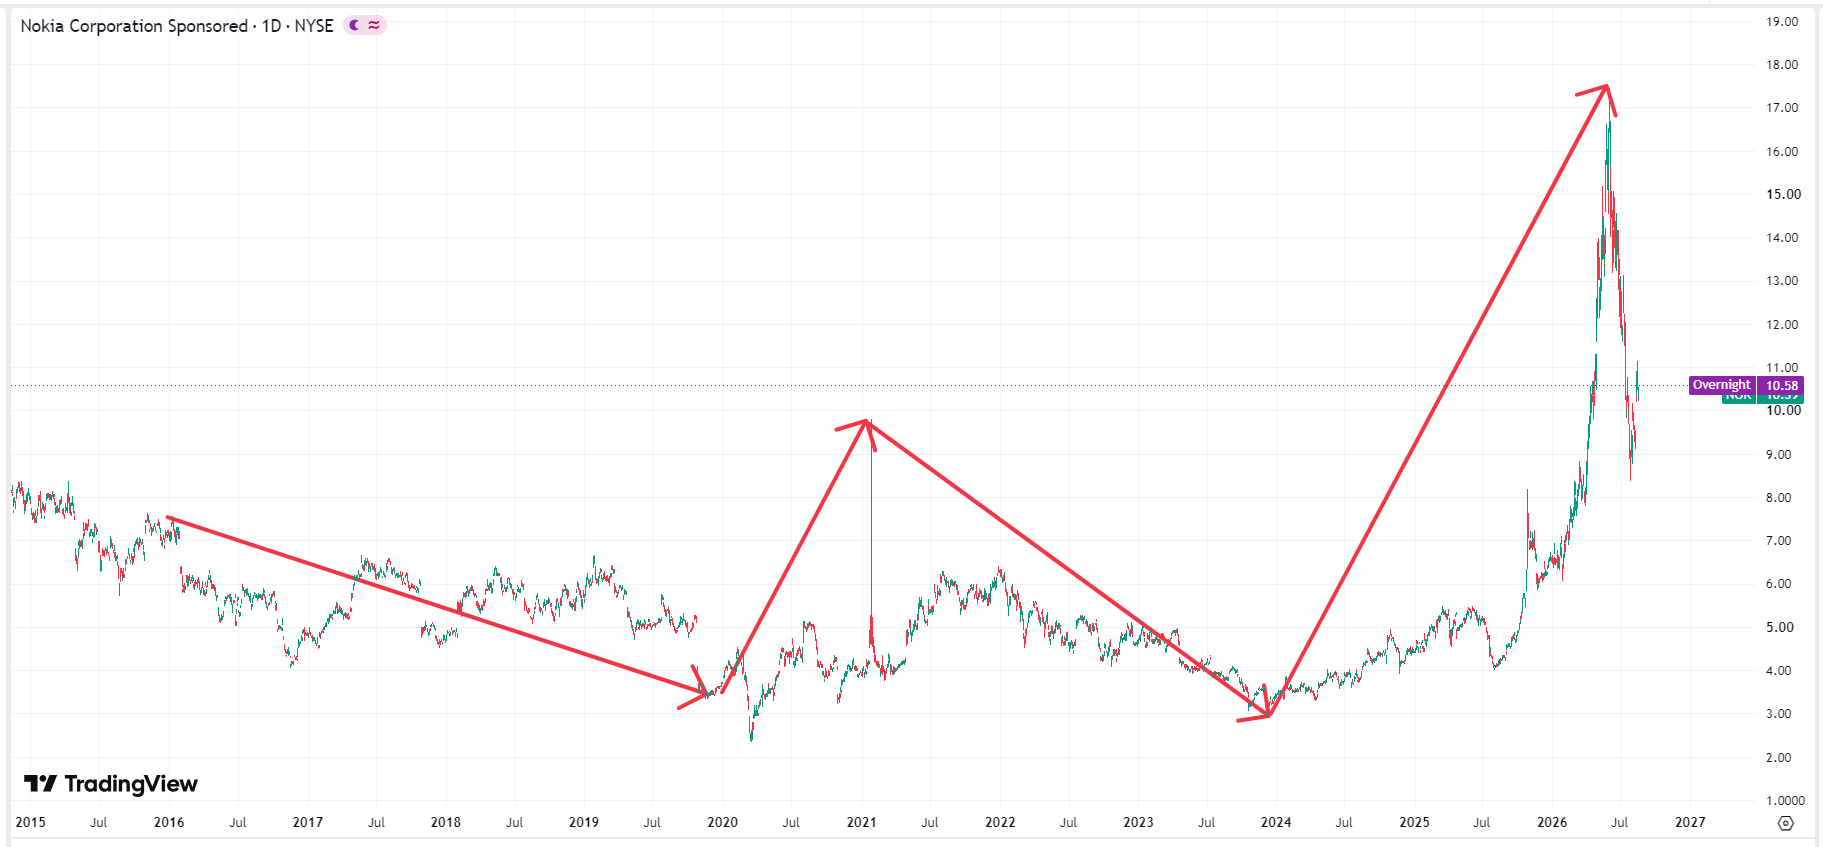 Nokia stock price chart,…