
Young women with headphones checks stock exchange price chart on digital exchange on a laptop at her desk at home.
getty
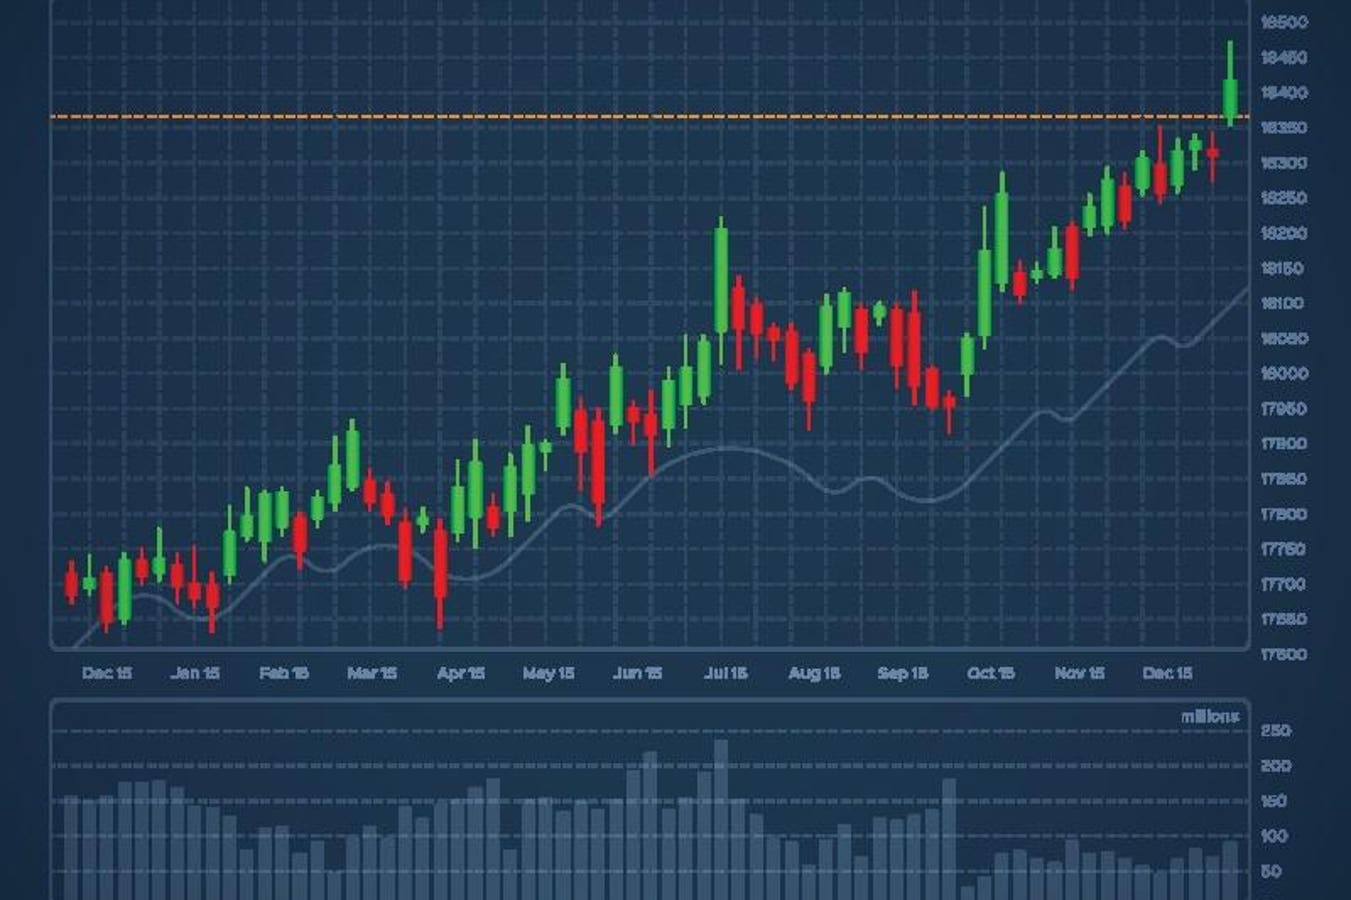
Open a stock chart for the first time, and it can feel overwhelming. But every mark is telling a simple story about buyers and sellers fighting over a price, and learning to read it is a genuinely useful skill for a new investor, whether the goal is trading individual names or just understanding why a portfolio moved the way it did last week.
I’ll explain chart types, core components and the patterns and indicators chartists lean on most. None of it requires expensive software — most brokerages and free charting sites already include it. One caveat: chart reading is a tool, not a crystal ball, and works best…