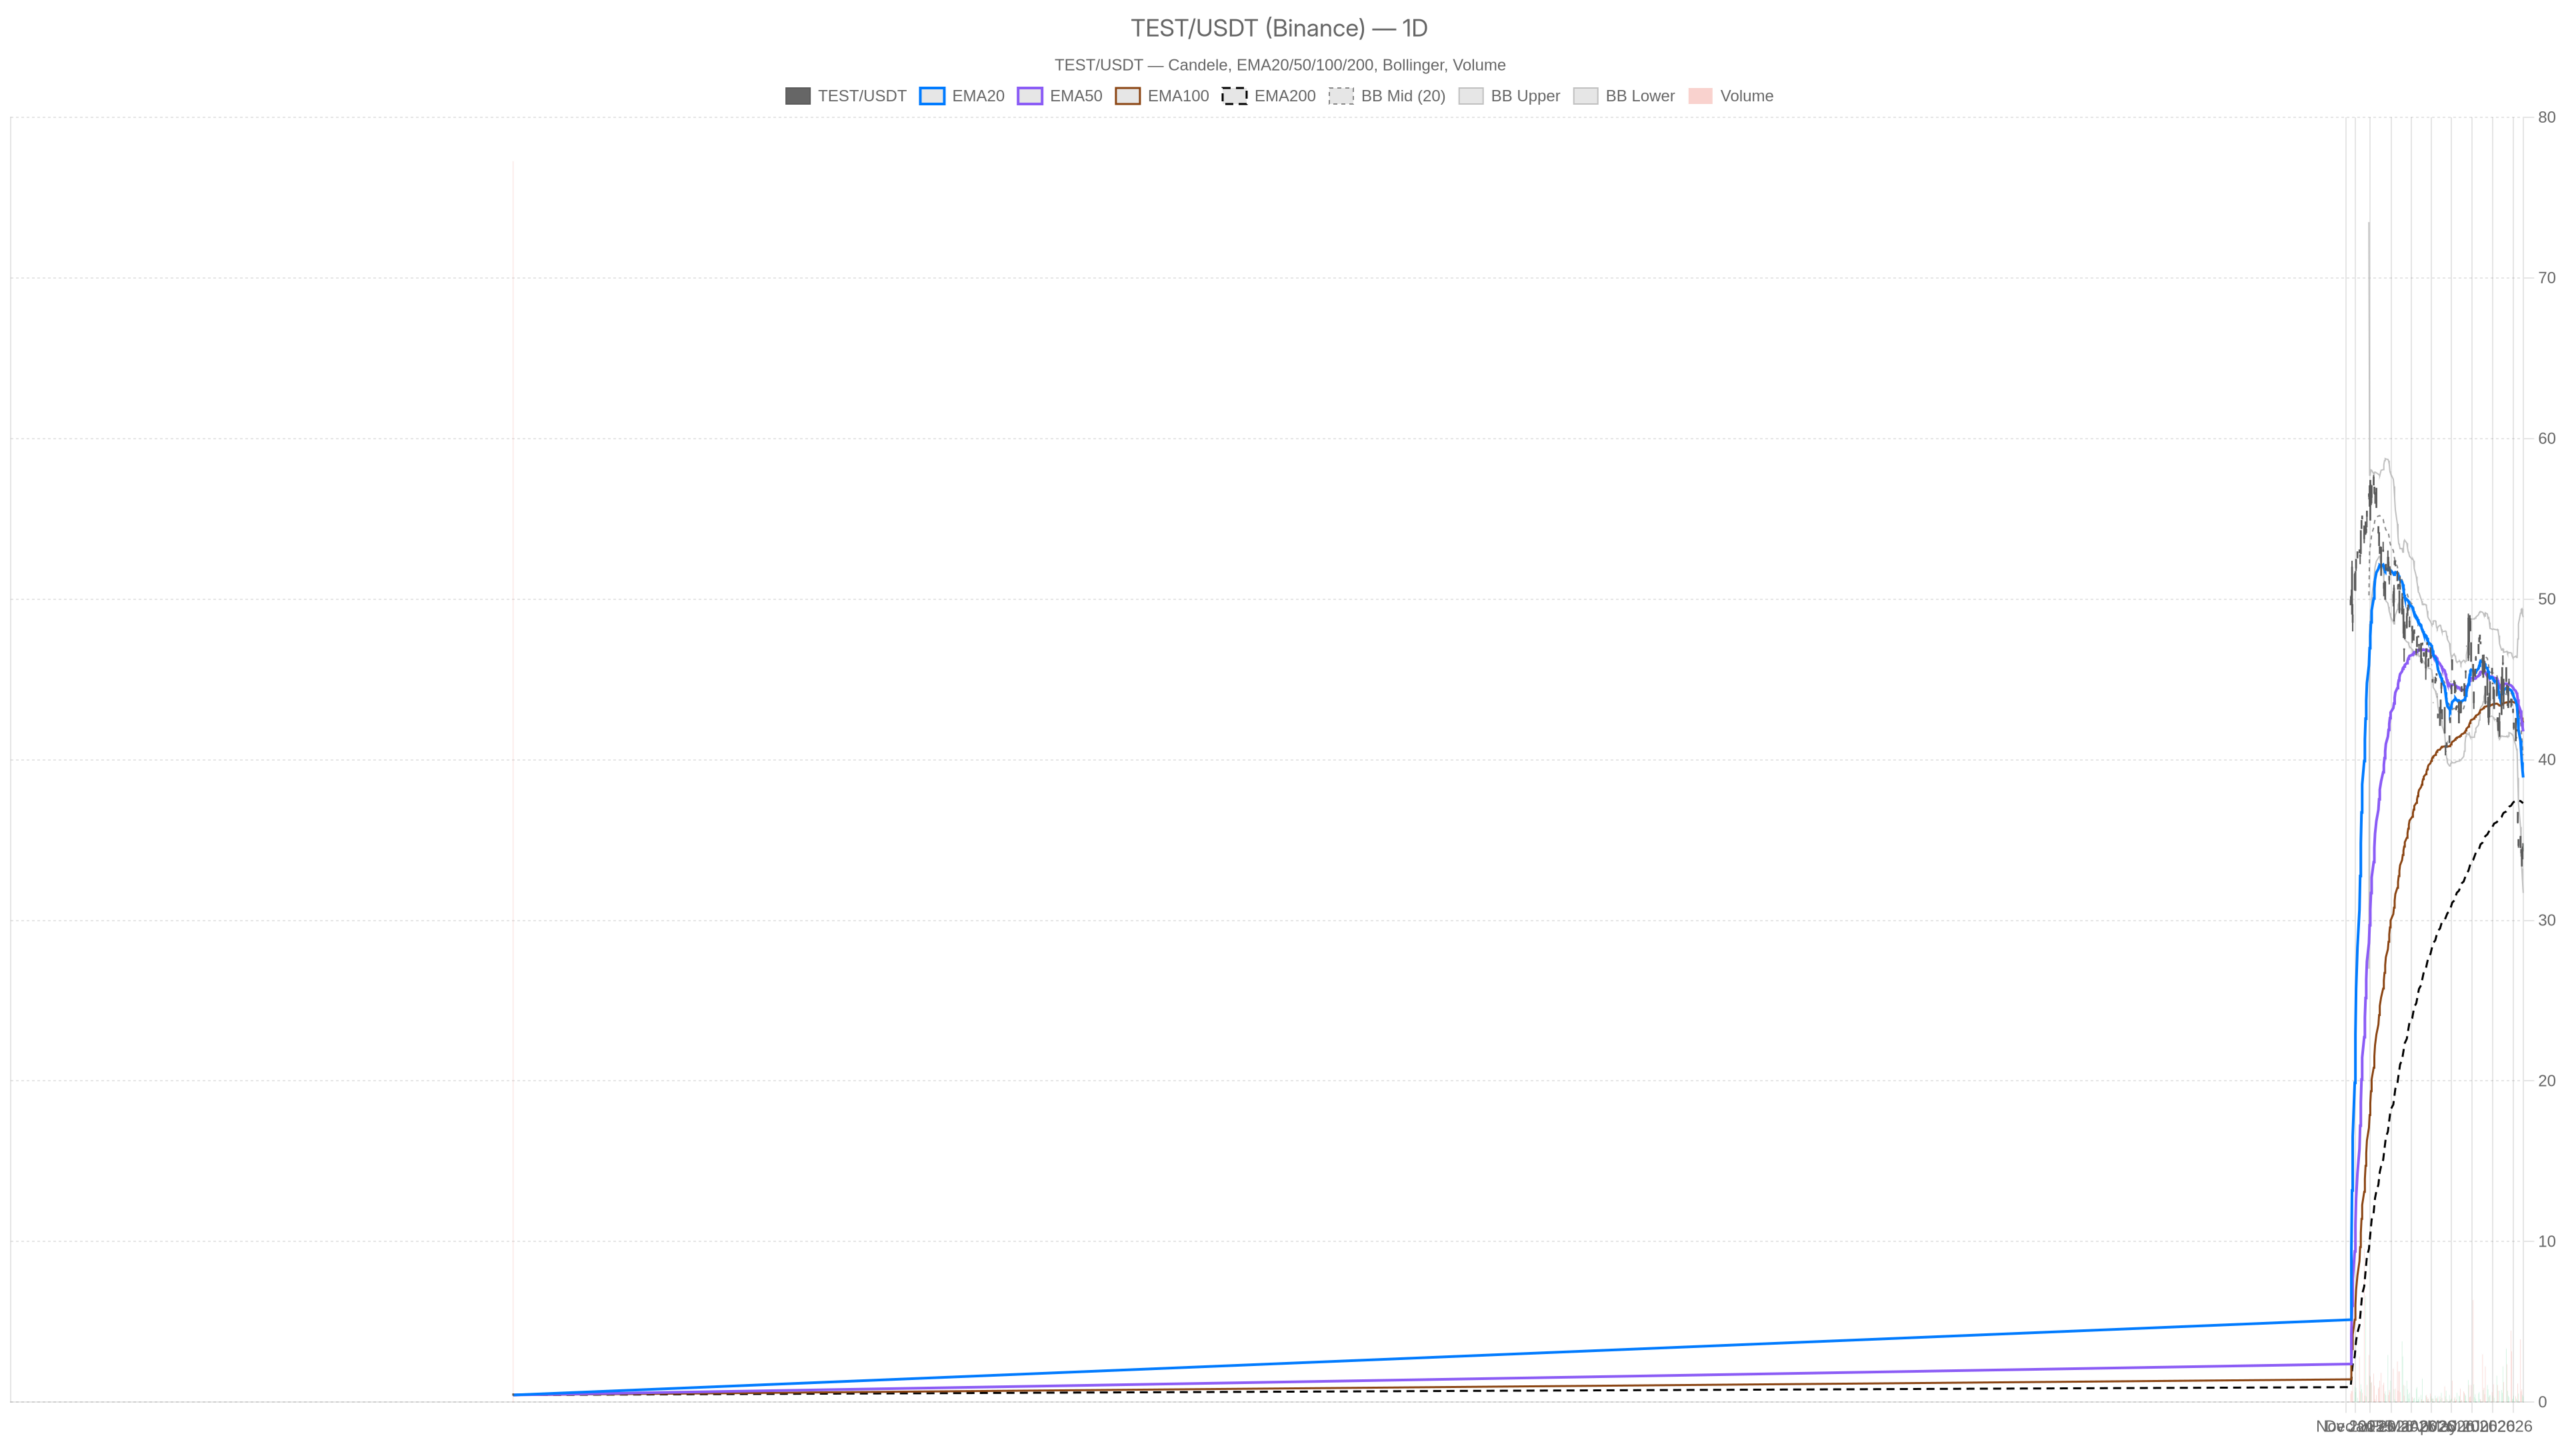
Amid ongoing interest in YieldMax TSLA Performance & Dis stock, TEST’s own chart merits attention. The daily structure is unambiguously weak. Yet intraday momentum is showing early signs of stabilization. This tension between a bearish trend and stabilizing momentum defines the current setup.
Key takeaways
- TEST closed at 34.77, below every major EMA — EMA20 at 38.89, EMA50 at 41.76, and EMA200 at 37.30 — forming a fully bearish stack.
- Daily RSI14 at 29.96 signals deeply oversold conditions, though oversold readings can persist during strong trends.
- 1H and 15m MACD histograms have turned positive at 0.40 and 0.30, hinting at short-term momentum stabilization.
- The…