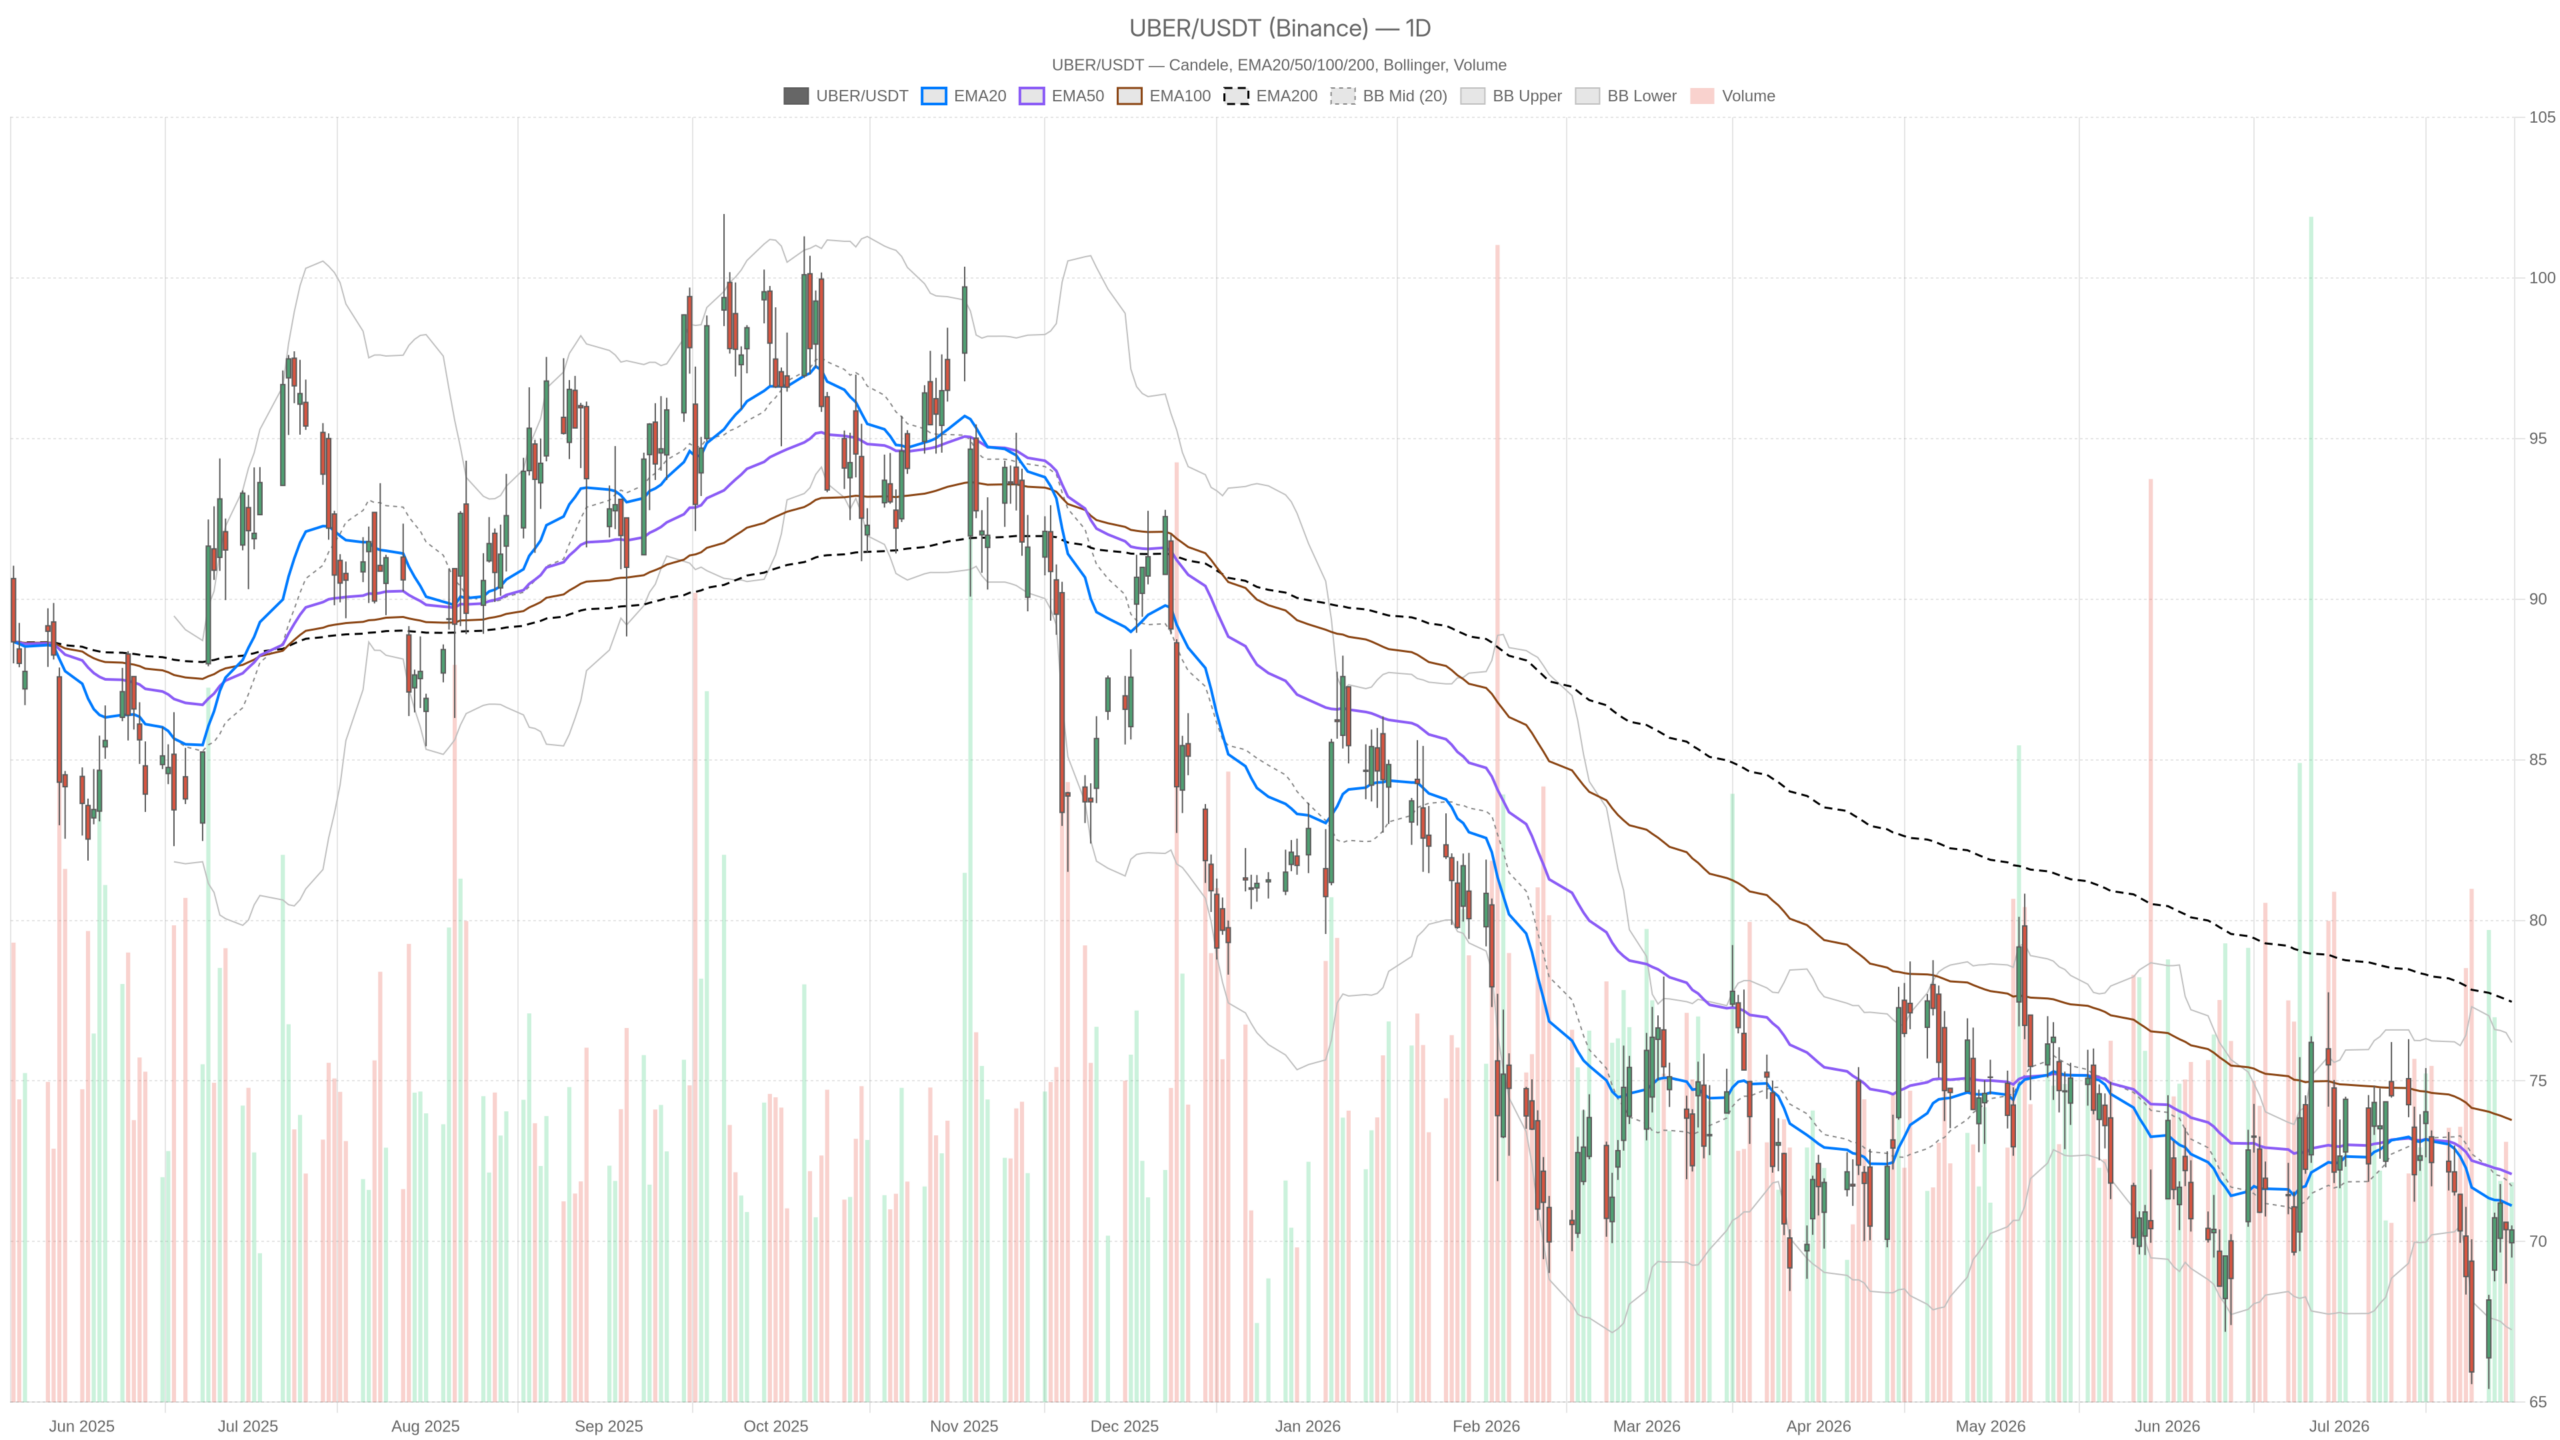
Uber Technologies, Inc. stock sits at a crossroads. The daily chart still points lower, with price trading beneath every major moving average. Yet buyers have stepped back in over the last few hours, creating tension between a tired daily trend and a fresher intraday bid.
Key takeaways
- UBER closed at $70.36, below its 20-day, 50-day, and 200-day EMAs — a textbook bearish regime on the daily chart.
- Daily MACD remains negative at -0.79 against a signal of -0.65, confirming sellers still hold the higher-timeframe edge.
- The hourly chart shows a neutral regime with a mild bullish tilt; price has reclaimed its 20 and 50-period EMAs but remains below the 200-period EMA at…