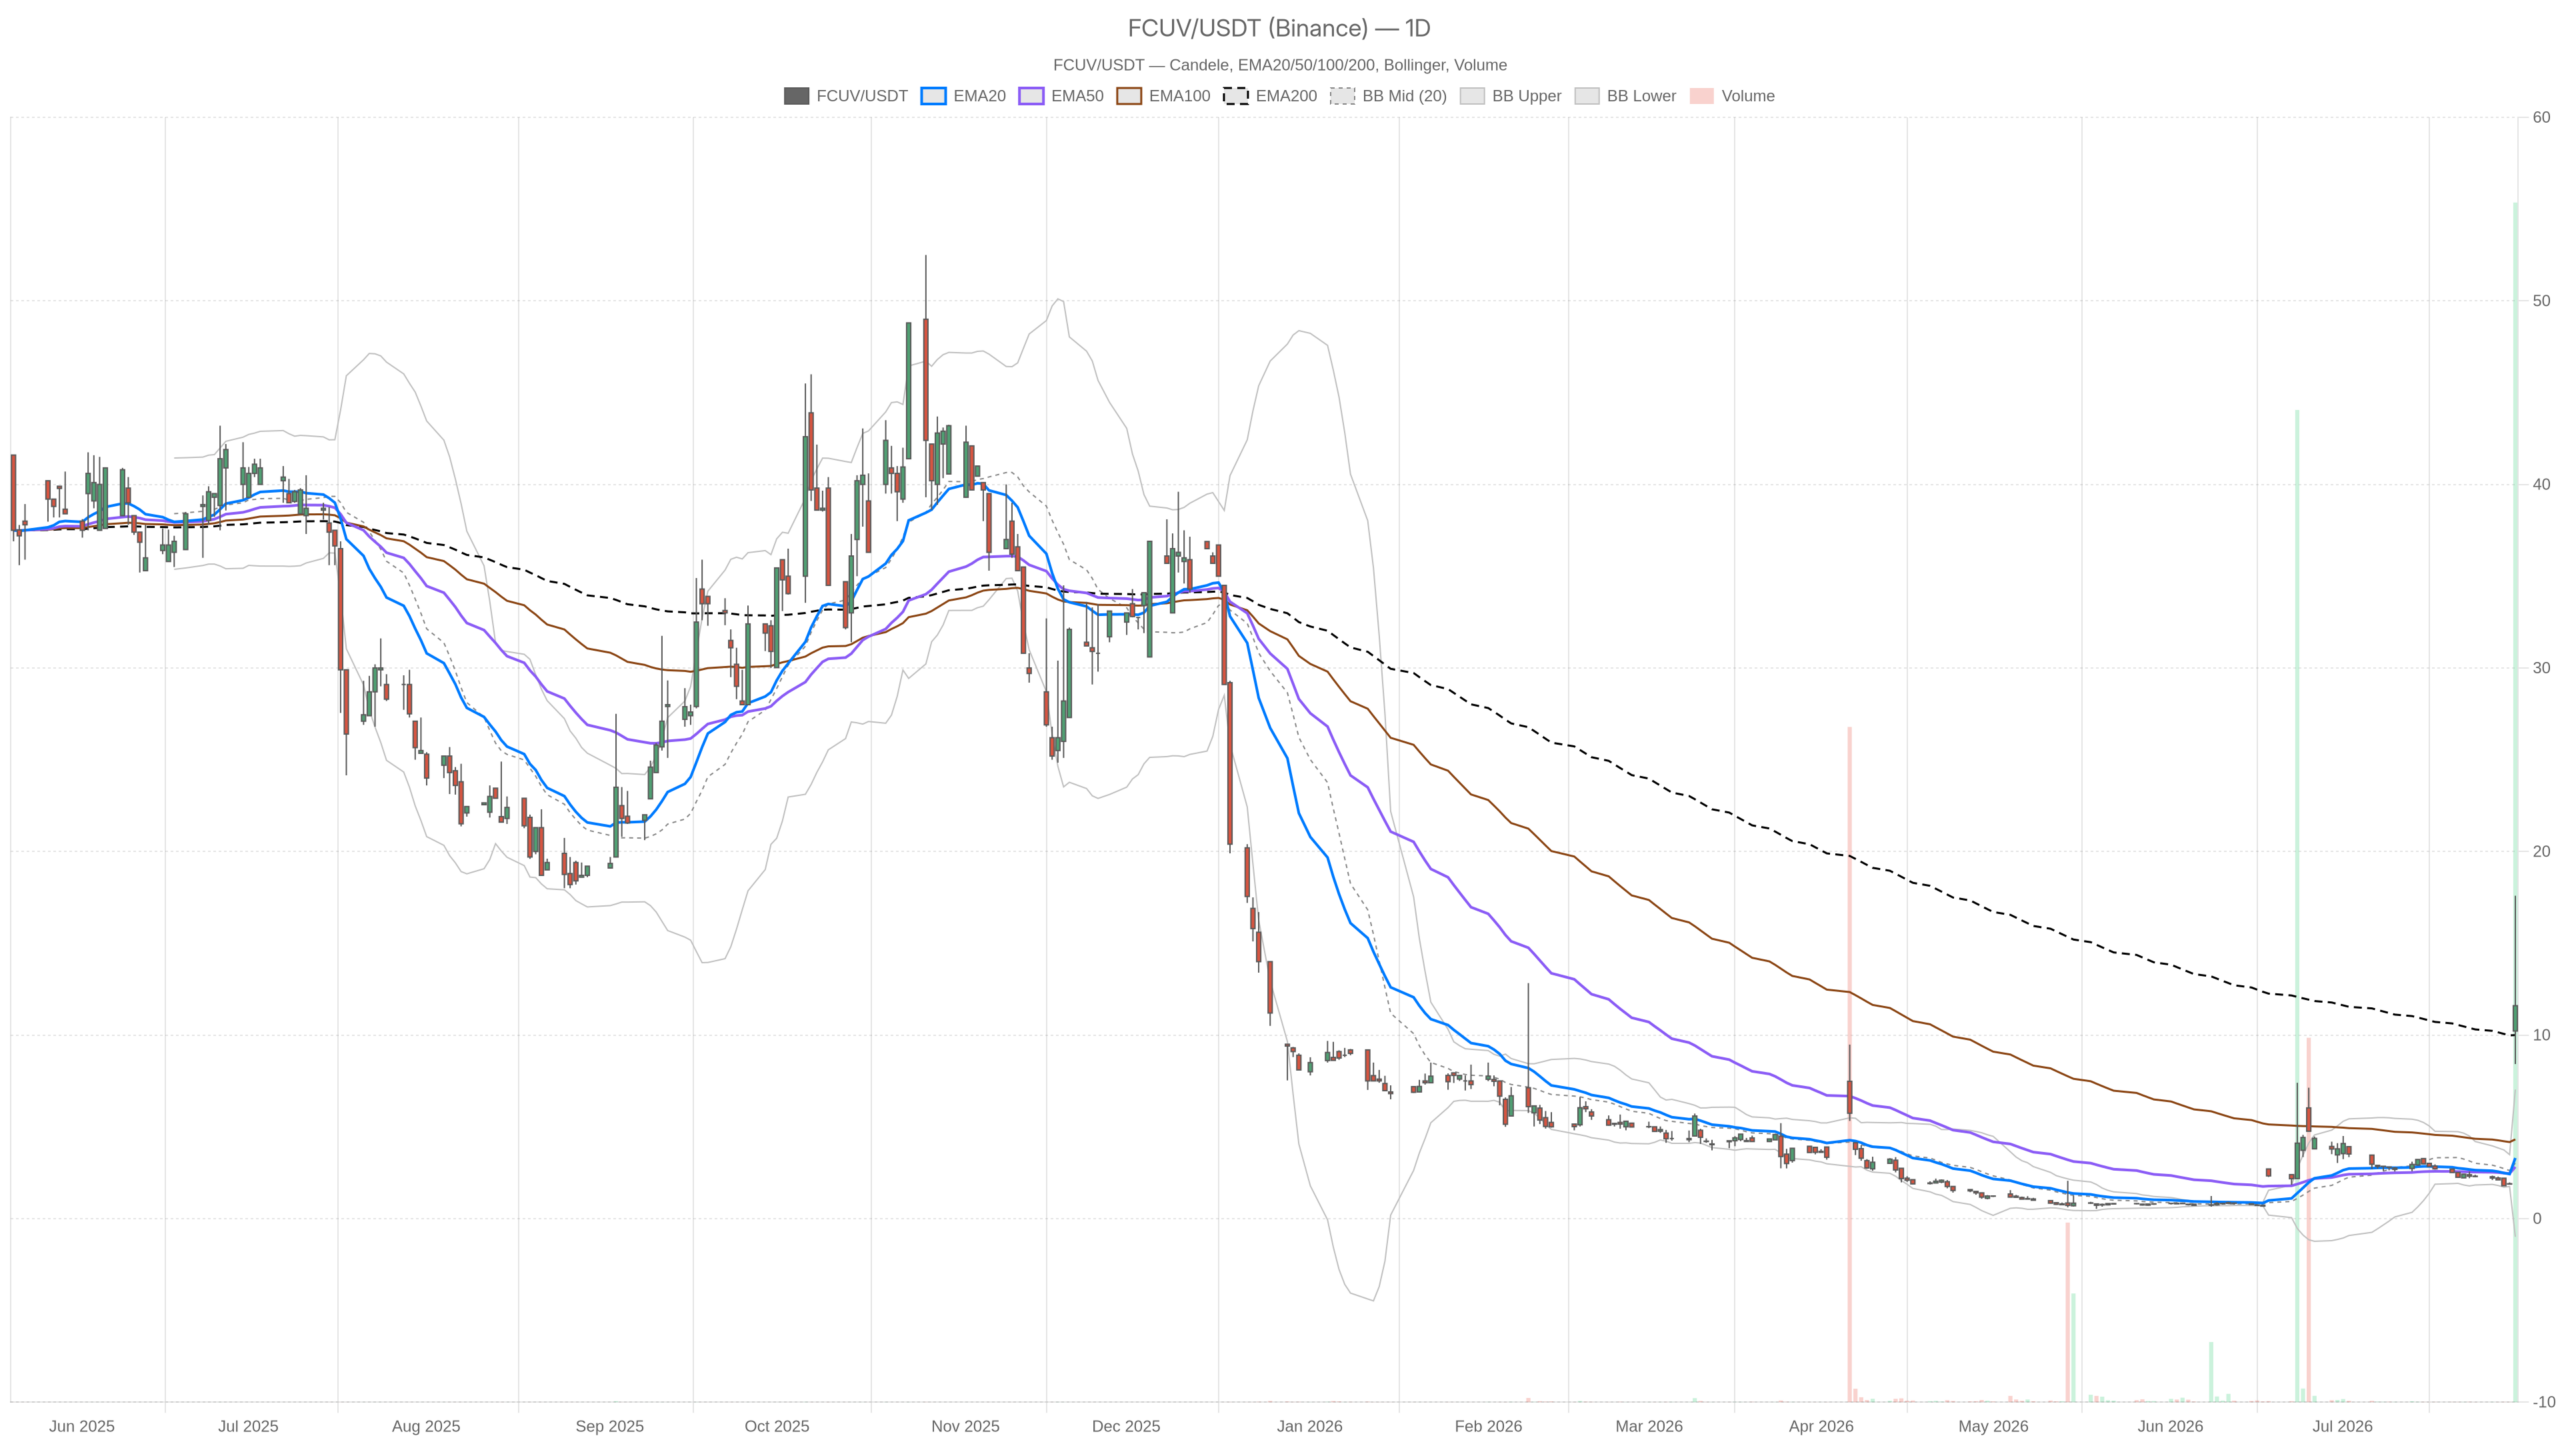
Focus Universal Inc. stock closed at $11.60 on July 31 after an explosive session spanning $8.42 to $17.59 on 93.4 million shares. The surface-level bullish surge masks deep intraday exhaustion, creating a market defined by conflicting signals across timeframes.
Key takeaways
- FCUV closed at $11.60 after an intraday range of $8.42 to $17.59 on July 31.
- Daily RSI14 reached 87.3, a historically extreme overbought reading.
- Volume exploded to 93.4 million shares, confirming speculative intensity.
- The daily pivot at $12.54 remains unreclaimed, with support at $7.48.
- The 15-minute chart shows momentum already flipping bearish despite the daily uptrend.