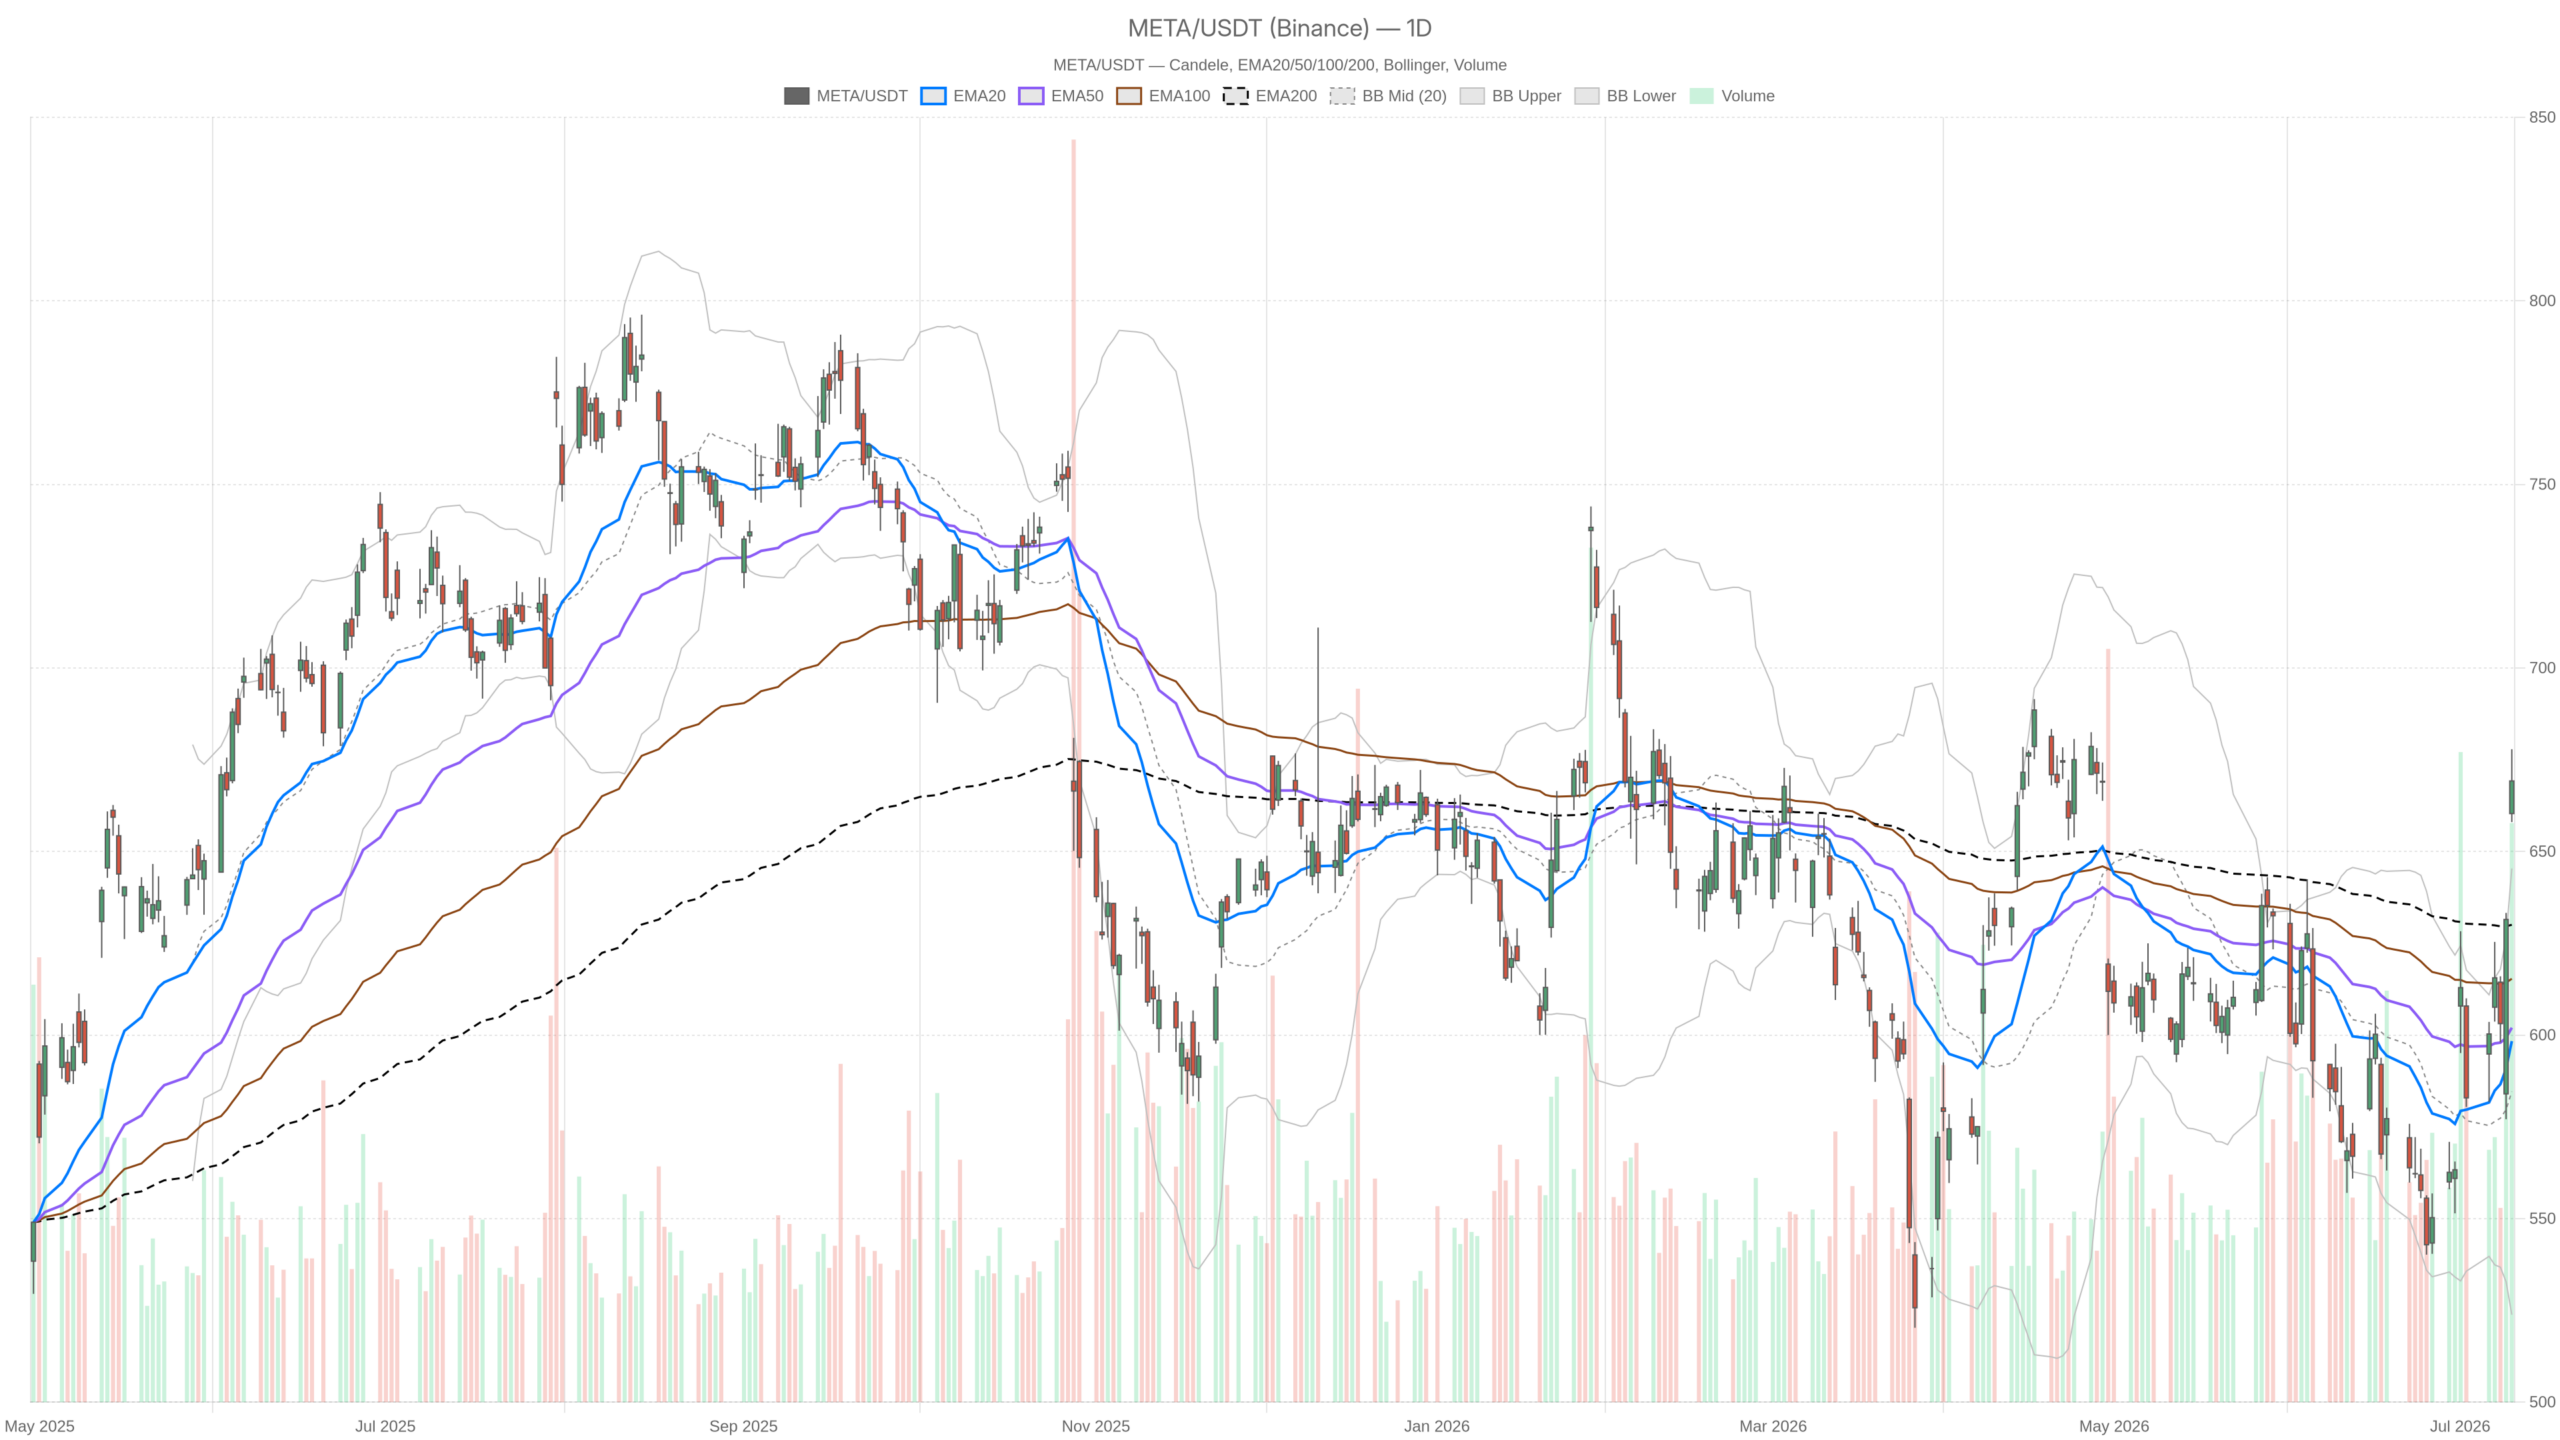
Meta Stock is printing a compelling setup heading into mid-July 2026. At $669.21, META has broken above all three major EMAs and is pressing against its daily Bollinger upper band. The thesis is bullish — but the pace is raising risk flags.
Key takeaways
- META closed at $669.21 on July 10, 2026, above all three daily EMAs — EMA20 at $598.34, EMA50 at $602.00, and EMA200 at $630.03
- Daily MACD is strongly bullish with a histogram of 11.18, while RSI at 66.34 approaches overbought territory
- Hourly RSI at 72.14 is firmly overbought, creating tension with the otherwise bullish structure
- The 15-minute chart shows a bearish MACD crossover, signaling near-term…