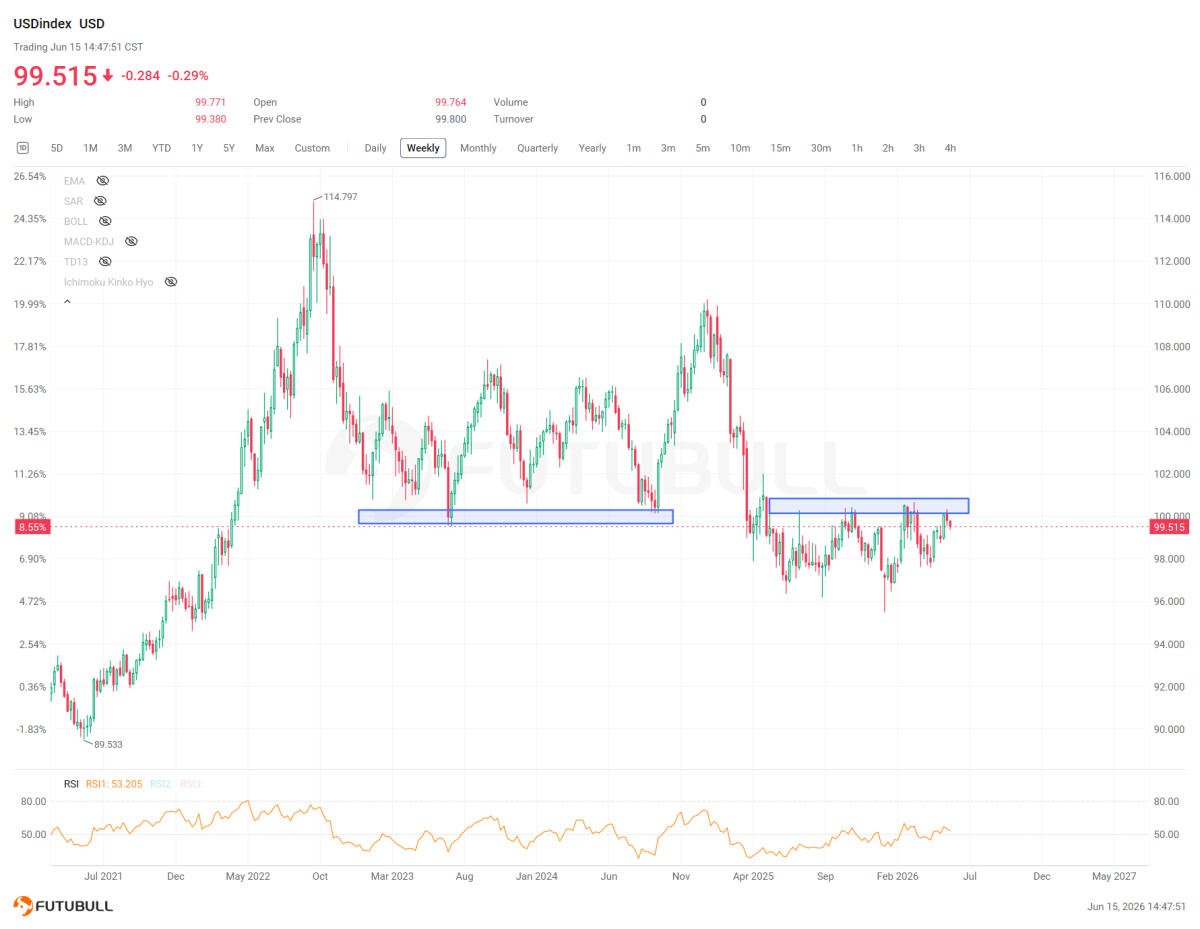
The line in the sand sits around 100.50. A breach alone means little; what the market needs to see is sustainability above that number — a reclaim that sticks, that attracts buyers on dips rather than sellers on rips. Here is why the monthly chart makes this setup so compelling: the 100–101 zone is not an arbitrary number plucked from thin air — it is one of the most significant resistance-turned-support levels in the Dollar Index’s modern history. For years, 100 was an impenetrable ceiling; when DXY finally broke above it decisively in 2022, that level was anointed as structural support, a line the market has returned to test — and defended — multiple times across different macro regimes.
The timing adds another layer of…