What Is This Chart?
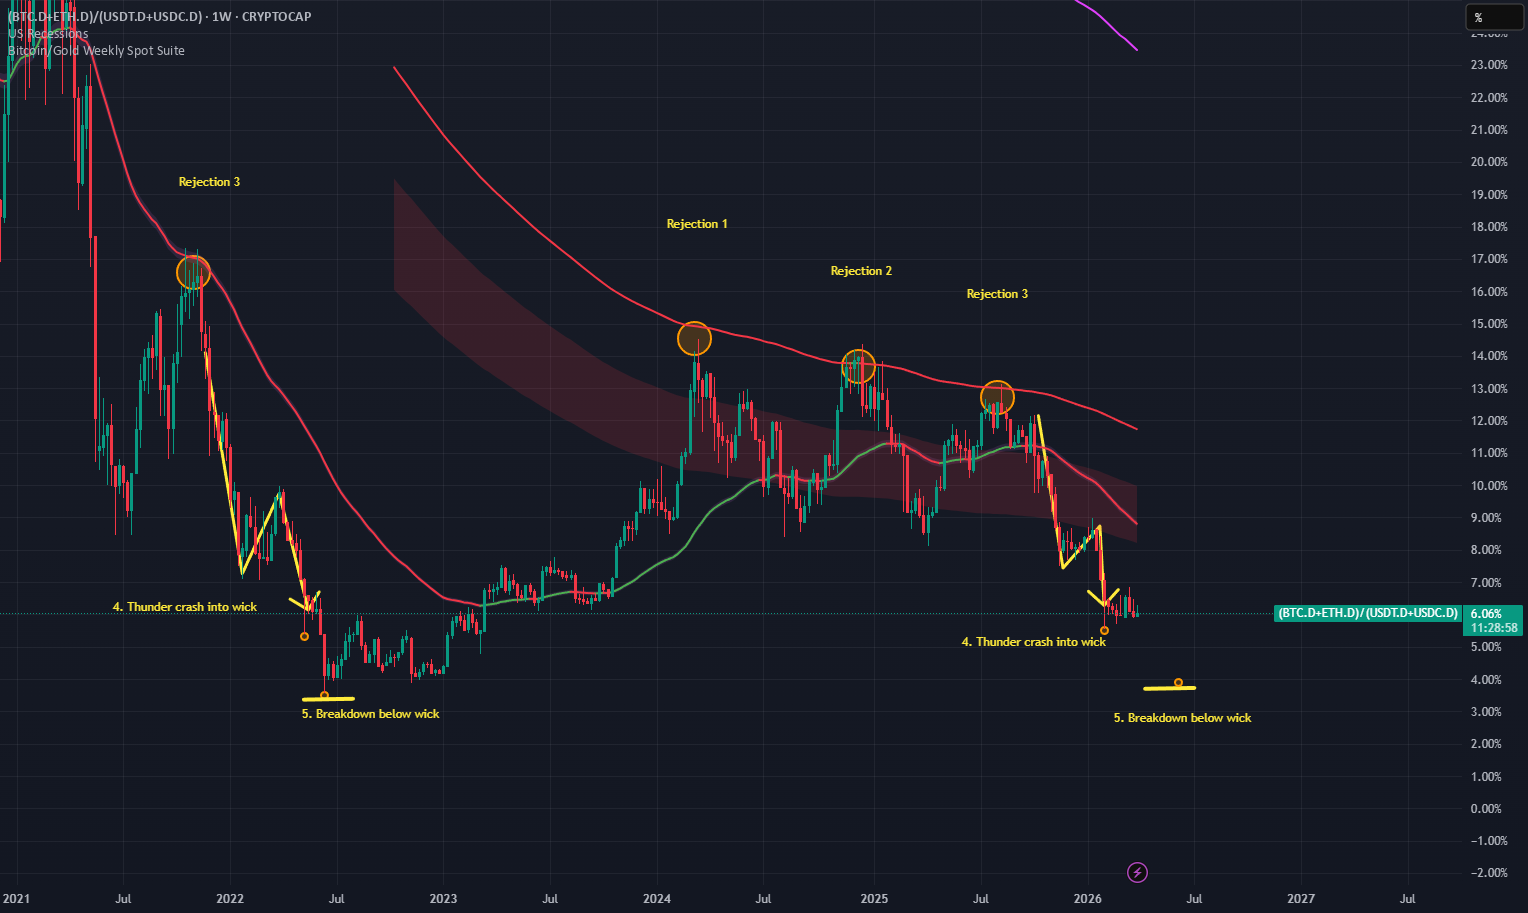
The (BTC.D + ETH.D) / (USDT.D + USDC.D) ratio is one of the more elegant macro tools in the crypto analyst’s toolkit. By dividing the combined dominance of Bitcoin and Ethereum against the combined dominance of the two largest stablecoins, the chart strips away price noise and reveals something more fundamental: the direction of liquidity flow. When the ratio falls, money is rotating out of the two blue-chip crypto assets and sheltering in stablecoins — a classic hallmark of risk-off sentiment and bear market conditions. When it bottoms and reverses, it has historically marked the point at which that fear reaches exhaustion, and a new bull cycle begins.
The 2020–2022 Cycle: A Five-Step Roadmap to the Bottom
Between…