

BXB stock analysis and Elliott Wave technical forecast [Video]
BRAMBLES LIMITED – BXB Elliott Wave Technical Analysis TradingLounge.
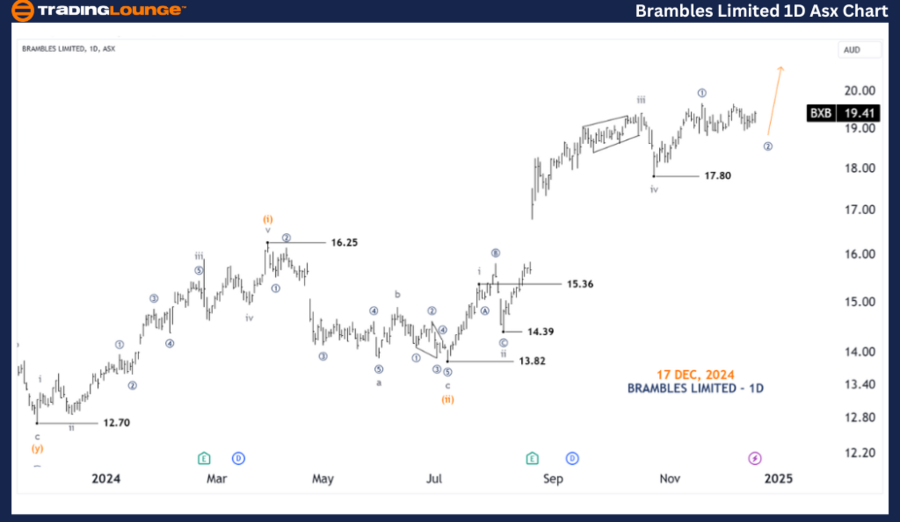
Greetings, Our Elliott Wave analysis today updates the Australian Stock Exchange (ASX) with BRAMBLES LIMITED – BXB. We see ASX:BXB could be about to push higher with a ((3))-navy wave.
BXB 1D chart (semilog scale) analysis
Function: Major trend (Minuette degree, orange).
Mode: Motive.
Structure: Impulse.
Position: Wave ((2))-navy of Wave v-grey.
Details: The v-grey wave may be extending, and it is close to completing the ((2))-navy wave itself, after which the ((3))-navy wave may push higher.
Invalidation point: 17.80.
BXB four-hour chart analysis
Function: Major trend (Minor degree, grey).
Mode: Motive.
Structure:…


